

JMX Monitoring
Java Virtual Machines (JVM) have built-in instrumentation that allow you to monitor and manage it using the Java Management Extensions (JMX) technology.
Why JMX?
JMX technology can be used for out-of-the-box management of Java Virtual Machines. The Java Virtual Machine (JVM) is highly instrumented using JMX technology. You can start a JMX agent to access the built-in Java VM instrumentation, and thereby monitor and manage a JVM remotely.
The framework makes use of MBeans for real-time management of applications. Magnolia provides the following mbeans:
- Cache Monitor: Hits, puts, bypasses, flushes, cached key count.
- JCR Stats: Session count.
JVM parameters
In order to enable JMX, the tomcat pod (magnoliaAuthor/magnoliaPublic) needs the following parameters in your project’s values.yml file:
magnoliaAuthor:
  catalinaExtraEnv:
    com.sun.management.jmxremote.port: "8099"
    com.sun.management.jmxremote.rmi.port: "8099"
    com.sun.management.jmxremote.authenticate: "false" <1>
    com.sun.management.jmxremote.ssl: "false"
    com.sun.management.jmxremote.local.only: "false"
    java.rmi.server.hostname: "localhost"
This example uses no authentication.
Service port
For the JMX agent to be reachable (internally), a service port must be enabled for the corresponding pod(s) in your project’s values.yml file:
magnoliaAuthor:
...
service:
  ports:
    - name: http
      port: 80
      protocol: TCP
      targetPort: 8080
    - name: jmx
      port: 8099
      protocol: TCP
      targetPort: 8099
Monitoring tools
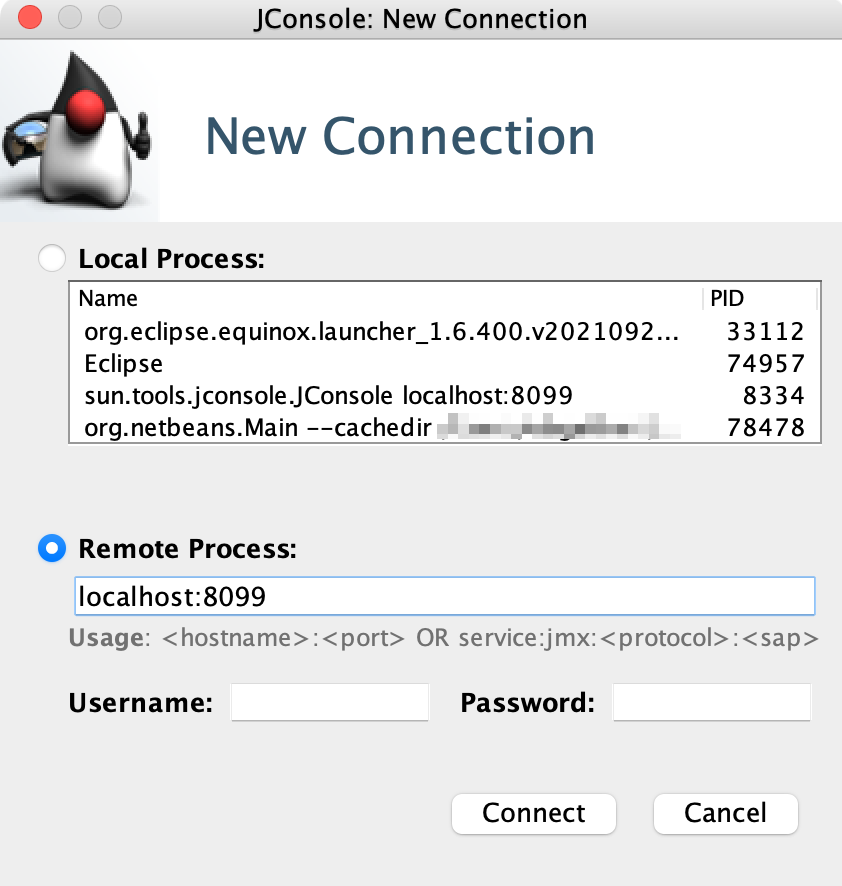
There are GUIs like JConsole that use the extensive instrumentation of the Java Virtual Machine (Java VM) to provide information about the performance and resource consumption of applications running on the Java platform.
In order for the monitoring tool to connect, you need to port forward to the tomcat pod/container:
kubectl port-forward pods/esservices-dev-magnolia-helm-author-0 8099:8099 -n esservices-devYou can now use localhost:8099 (with no authentication nor ssl) to connect.
Example
The New Connection
VisualVM
You can also use VisualVM as your monitoring tool.