

DX Cloud Alerts
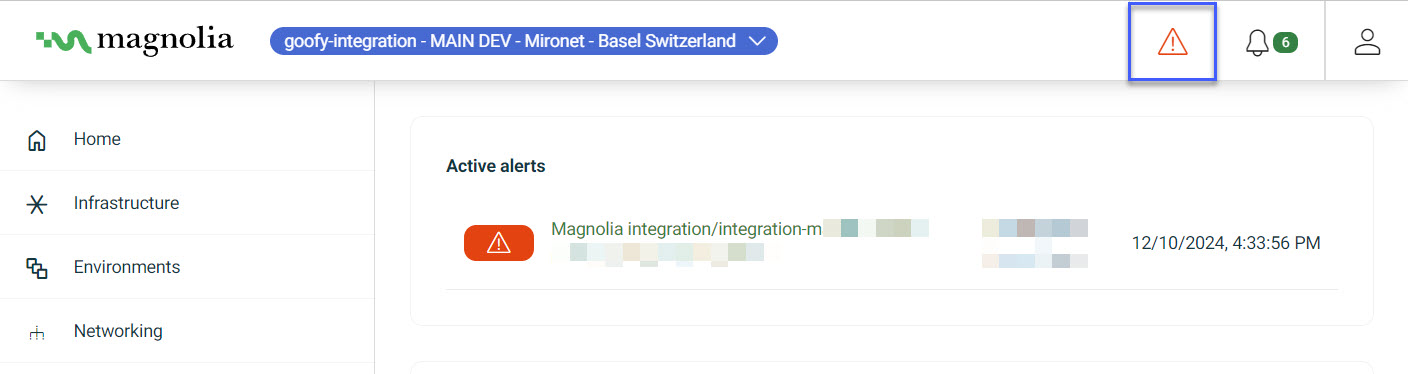
DX Cloud alerts give a closer look at the status of your cluster(s). If there is an active alert, you see a notification at the top of the Cockpit.
There are three categories of alerts:
For runbooks on specific alert names, see Troubleshooting alerts in DX Cloud Operations.
Select desired cluster
Select your desired cluster from the dropdown menu at the top of the Cockpit.

Active alerts
Active alerts are currently firing for your cluster and should be investigated.

Pending alerts
Pending alerts mean that at least one time series returned by the evaluation engine is Pending.

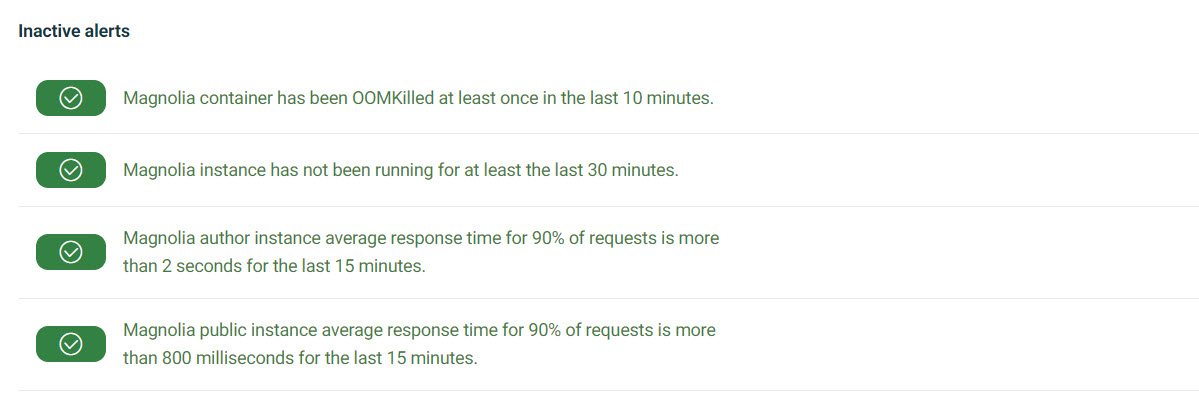
Inactive alerts
Inactive alerts have already occurred. Use them for information and history.
Alert types
The following are the current alerts for DX Cloud. Linked names open the Operations troubleshooting page when one exists.
| Alert | Description |
|---|---|
| CustomerMagnoliaContainerOomKilled | Magnolia container has been OOMKilled at least once in the last 10 minutes. |
| CustomerMagnoliaDown | Magnolia instance has not been running for at least the last 30 minutes. |
CustomerMagnoliaServiceErrors | Magnolia service has application errors (503) for the last 5 minutes. |
| CustomerMagnoliaSlowResponse | Magnolia author average response time for 90% of requests is more than 2 seconds for the last 15 minutes. Also covers CustomerMagnoliaPublicSlowResponse (public: more than 800 milliseconds for 90% of requests over 15 minutes). |
| CustomerClusterHighMemoryPressure | A node in a customer cluster is under heavy memory pressure. Available memory is under 5% and there is a high rate of major page faults. |
| CustomerClusterFileSystemAlmostFull | The filesystem on a customer cluster has less than 1% space available. |
| CustomerClusterFileSystemFillingUp | The filesystem on a customer cluster has less than 30% space available and is projected to be full within 8 hours. |
| CustomerDatabasePersistentVolumeFillingUp | A database persistent volume used by Magnolia has less than 1% space available. You may not be able to successfully add or publish content. |
| CustomerDatabasePersistentVolumeAlmostFull | A database persistent volume on a customer cluster has less than 10% space available. |
| CustomerMagnoliaHomePersistentVolumeAlmostFull | A Magnolia home persistent volume has less than 10% space available. Try removing search indexes on the affected volume to free space. |
| CustomerCertificateExpiring | The certificate for a host/ingress on a customer cluster is expiring in 14 days. |
| CustomerTomcatHighLoad | Tomcat is using more than 20% of its thread pool for the last 10 minutes. |
| CustomerMagnoliaCrashLooping | Magnolia instance is being restarted frequently by Kubernetes. |
| CustomerBackupCentralDown | The central backup server in your cluster is not running or not responding for at least 1 hour. Backups may not be saved. |
| CustomerElevatedServiceErrors | A service on your production cluster is returning errors (5xx) for more than 10% of requests for the last 10 minutes. |