

Overview
The Overview page monitors your DX Cloud subscription performance and resource usage. Each metric card compares measured usage against your subscribed (contracted) value for the selected period, and shows whether you are above or below target.
You can expand What is this? on each card in the Cockpit for the same guidance documented here.
Use the date picker to select a Date range and Data resolution (minute, hour, day, week, or month) when viewing Overview metrics.
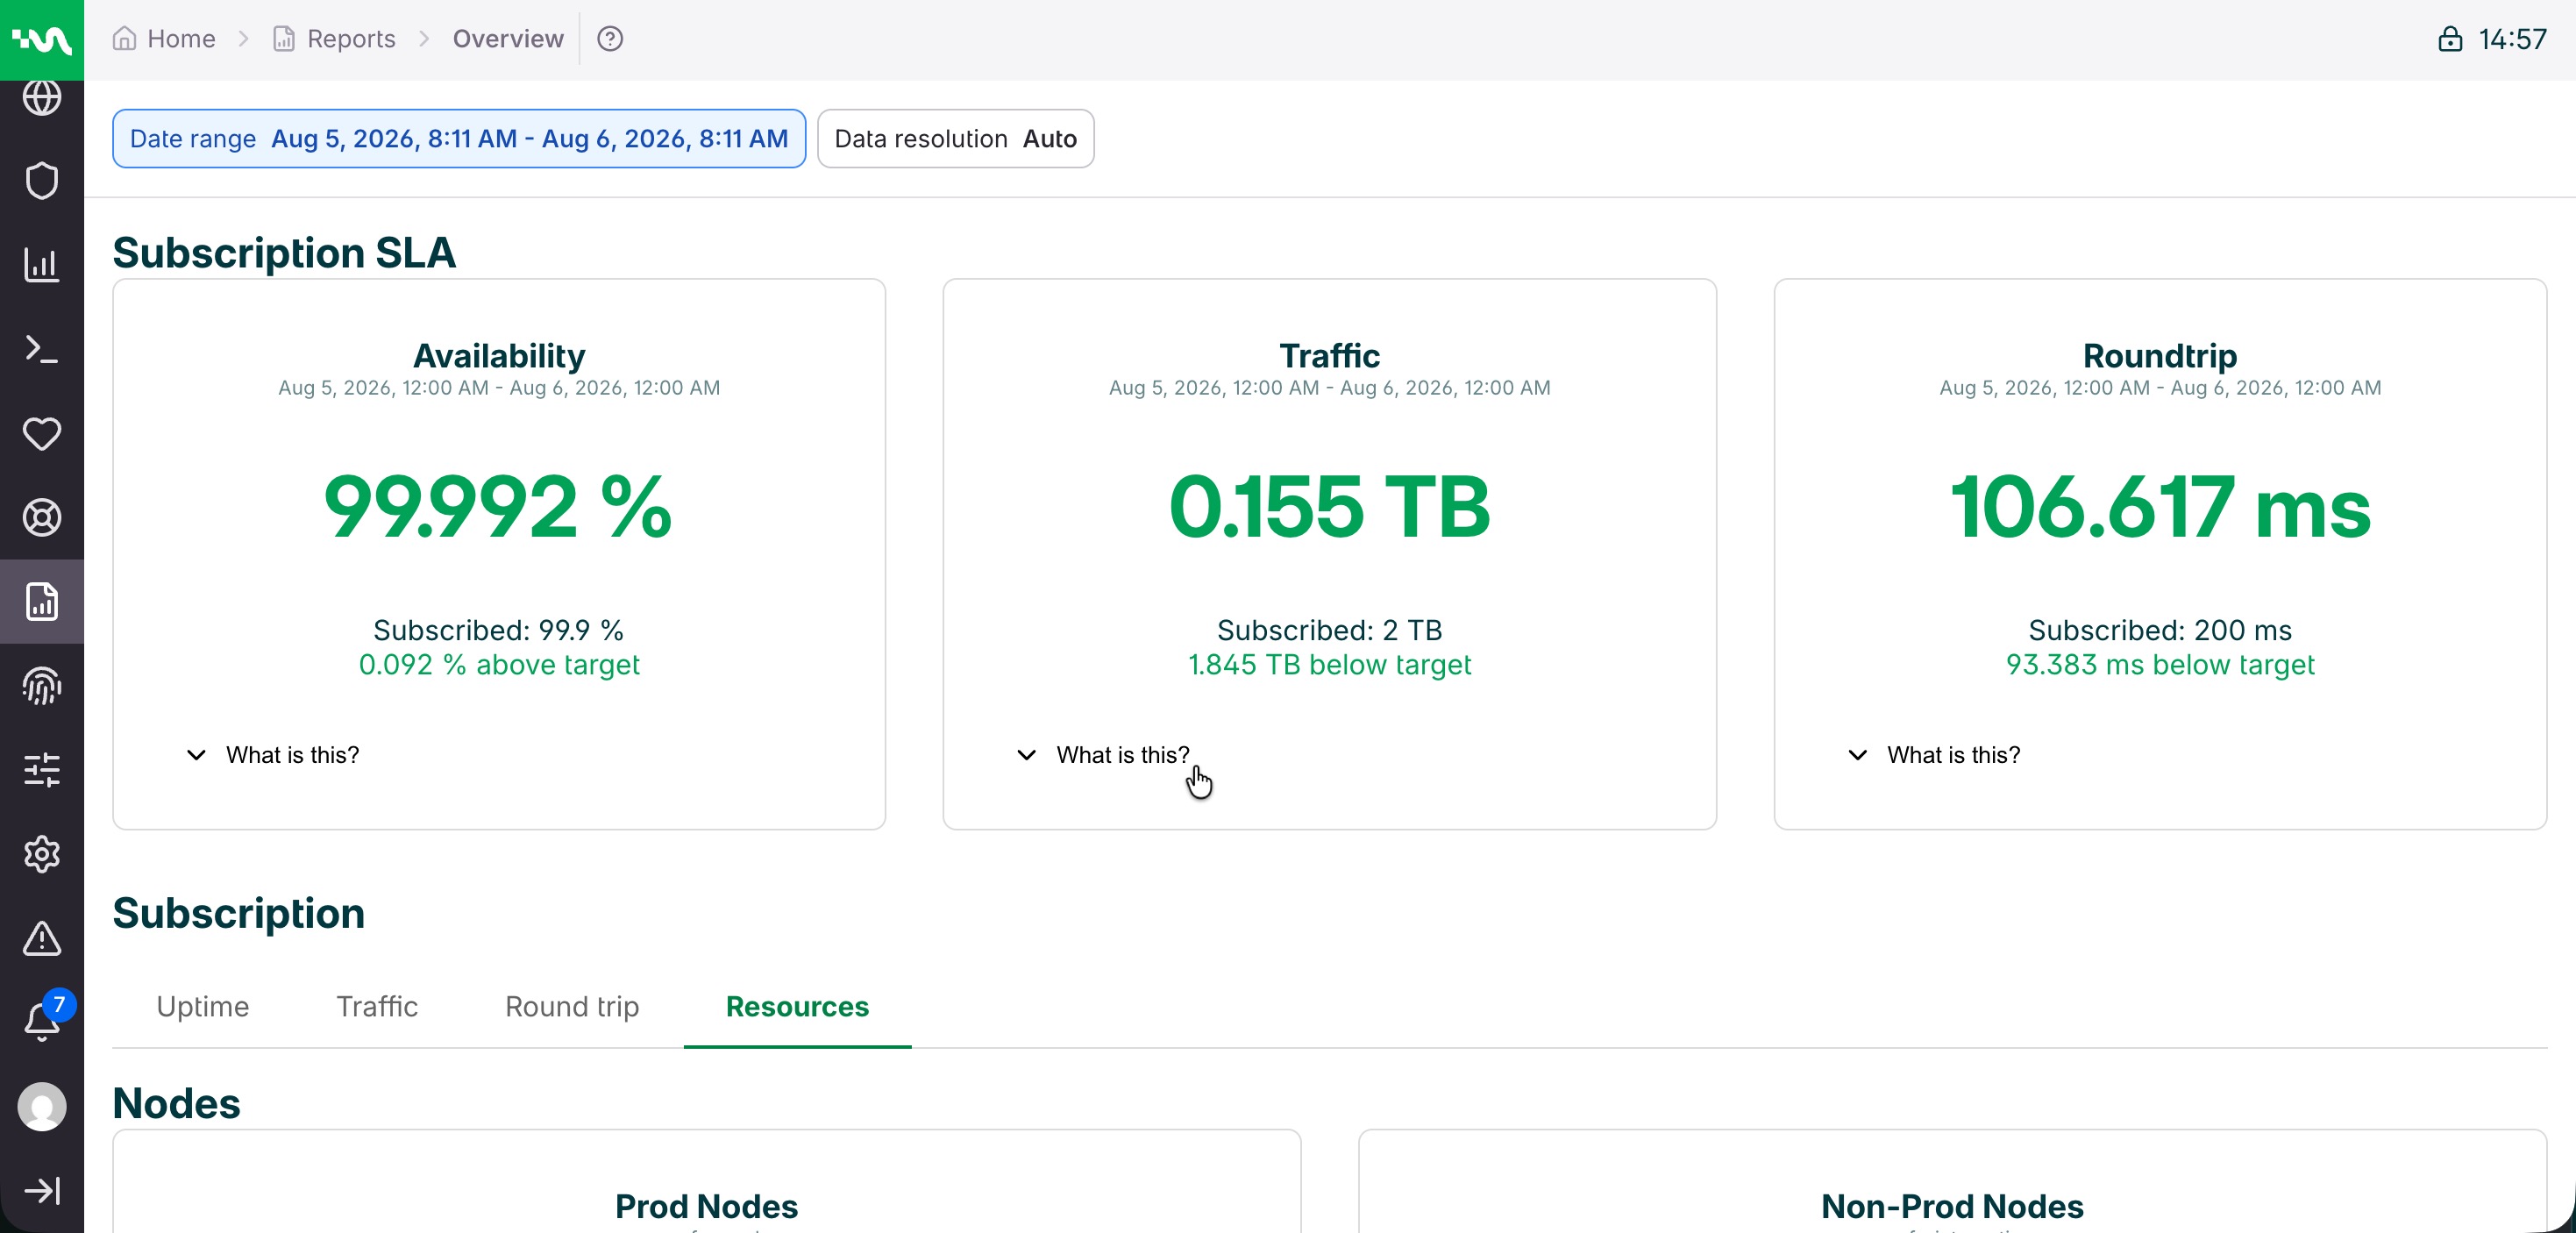
Subscription SLA
The Subscription SLA area summarizes three contractual commitments for the selected period:
- Availability
- Traffic
- Roundtrip
Availability
This shows your subscribed Service Level Agreement for service availability. SLA values represent the guaranteed uptime percentage committed in your service agreement.
- Measurement: Guaranteed uptime percentage
- Contract: Your agreed service level commitment
- Monitoring: Tracked against actual service performance
SLA metrics provide the baseline against which your actual service performance is measured for compliance and service credit calculations.
Traffic
This displays your subscribed data transfer limits as defined in your service agreement. These values represent your contracted traffic allowances.
- Measurement: Contracted data transfer limits
- Allowance: Your subscribed traffic capacity
- Billing: Baseline for usage calculations
Traffic SLA defines your committed data transfer capacity across all services in your subscription plan.
Roundtrip
This shows your contracted response time commitments as specified in your service level agreement. SLA values represent the maximum response time guarantees.
- Measurement: Guaranteed maximum response time in milliseconds
- Contract: Your agreed performance commitment
- Monitoring: Baseline for response time compliance
Response time SLA defines the performance standards your services are committed to maintain for optimal user experience.
Uptime
The Uptime tab shows availability (as a percentage) for CDN, Ingress, and Magnolia over the selected period.
CDN availability
This metric shows the uptime percentage for your CDN (Content Delivery Network) service. It measures how often your content delivery network is accessible to users worldwide.
- Expected: Your subscribed SLA level (typically 99.9% or higher)
- Current: Actual performance over the selected time period
- Monitoring: Measured from multiple global locations every minute
The CDN availability directly impacts your website’s performance for end users. Lower availability means users may experience slower load times or inability to access your content.
Ingress availability
This shows the uptime percentage for your ingress load balancer. It measures how accessible your Magnolia instances are through the ingress gateway.
- Expected: Your subscribed SLA level
- Current: Actual performance over the selected time period
- Impact: Affects all traffic routing to your Magnolia instances
The ingress serves as the entry point for all requests to your Magnolia CMS. High availability here is crucial for both author and public instances.
Magnolia availability
This displays the uptime percentage for your Magnolia CMS instances. It measures how often your author and public instances are running and accessible.
- Expected: Your subscribed SLA level
- Current: Actual performance over the selected time period
- Includes: Both author and public instance availability
This metric reflects the core availability of your Magnolia CMS application, including the author interface and public website delivery.
Traffic
The Traffic tab shows data transfer volume (in TB) for CDN and Ingress over the selected period.
CDN traffic (including Ingress)
This shows the combined data transfer volume for both your CDN service and ingress traffic. The number displayed represents the total of CDN and ingress data transfer already summed together.
Traffic is measured in TiB and includes all data flowing through both your content delivery network and ingress load balancer.
- Measurement: Combined total data transfer in TiB (CDN + Ingress)
- CDN portion: Cache hits, cache misses, and origin requests
- Ingress portion: All traffic routed through your load balancer
- Billing Impact: May affect costs if you exceed your plan limits
This combined metric gives you a complete view of all external data transfer for your subscription. High values typically indicate good traffic distribution and content delivery performance across both CDN and ingress systems.
Ingress traffic
This displays the data transfer volume through your ingress load balancer. All traffic to your Magnolia instances passes through this ingress point.
- Measurement: Total data transfer in TiB
- Includes: All HTTP/HTTPS requests to your instances
- Monitoring: Helps track overall system load
Round trip
The Round trip tab shows average response time (in ms) for CDN and Ingress over the selected period.
CDN round trip
This measures the average response time for requests served by your CDN. Lower values indicate better performance for your users.
- Measurement: Average response time in milliseconds
- Global: Measured from multiple worldwide locations
- Target: Typically under 100ms for optimal user experience
Fast CDN response times ensure users worldwide get quick access to your content.
Ingress round trip
This shows the average response time for requests to your ingress load balancer. This includes the time to route requests to your Magnolia instances.
- Measurement: Average response time in milliseconds
- Includes: Load balancing and routing time
- Impact: Affects overall page load performance
Resources
The Resources tab shows cluster capacity usage for nodes, CPU, and memory. Cards are grouped by production, non-production, and satellite clusters where applicable.
Nodes
Production nodes
This metric shows the number of Kubernetes nodes allocated to your production clusters.
- Measured: Current number of active nodes
- Contracted: Number of nodes in your subscription plan
- Impact: Affects compute capacity, redundancy, and availability
Production nodes handle your live website traffic and are critical for maintaining high availability and performance.
Non-production nodes
This shows the number of Kubernetes nodes allocated to your development, testing, or staging clusters.
- Measured: Current number of active nodes
- Contracted: Number of nodes in your subscription plan
- Usage: Development, testing, and staging environments
Non-production nodes provide isolated environments for development and testing before deploying to production.
CPU
Production CPU
This metric shows CPU core usage across your production clusters.
- Reserved: CPU cores currently allocated to running workloads
- Available: Additional CPU capacity available for scaling
- Contracted: Total CPU cores in your subscription plan
CPU usage directly impacts application performance and response times for your live websites.
Non-production CPU
This shows CPU core usage across your development and testing clusters.
- Reserved: CPU cores currently allocated to running workloads
- Available: Additional CPU capacity available
- Contracted: Total CPU cores allocated to non-production environments
Non-production CPU supports development workflows, testing, and staging activities.
Memory
Production memory
This metric shows RAM usage across your production Magnolia clusters.
- Reserved: Memory currently allocated to running applications (in GB)
- Available: Additional memory available for scaling (in GB)
- Contracted: Total memory in your subscription plan (in GB)
Memory usage affects application performance, caching effectiveness, and the ability to handle traffic spikes.
Non-production memory
This shows memory usage across your development and testing environments.
- Reserved: Memory currently allocated to running applications (in GB)
- Available: Additional memory available (in GB)
- Contracted: Total memory allocated to non-production (in GB)
Non-production memory supports development activities and testing workloads.