

CDN statistics
You can view your CDN statistics for an active domain in a content delivery server.
Select desired cluster
Select your desired cluster from the dropdown menu at the top of the Cockpit.

Purge All
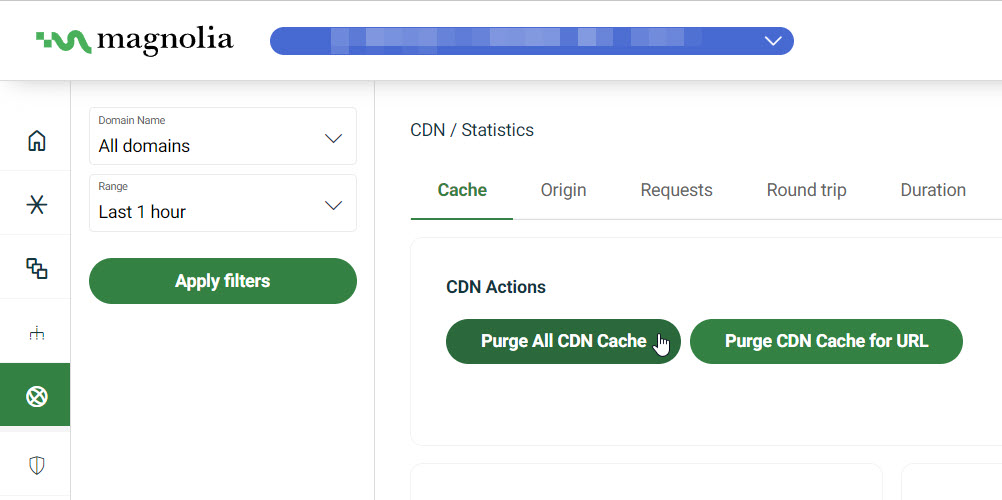
To purge the entire cache from the content delivery server for the domains in the selector, click Purge All CDN Cache. Alternatively, you can purge by URL.
Purge URL
Instead of purging the entire cache, you may want to purge a single object or directory from all cache servers. Use Purge CDN Cache for URL in the Cockpit.
- Go to CDN > Statistics.
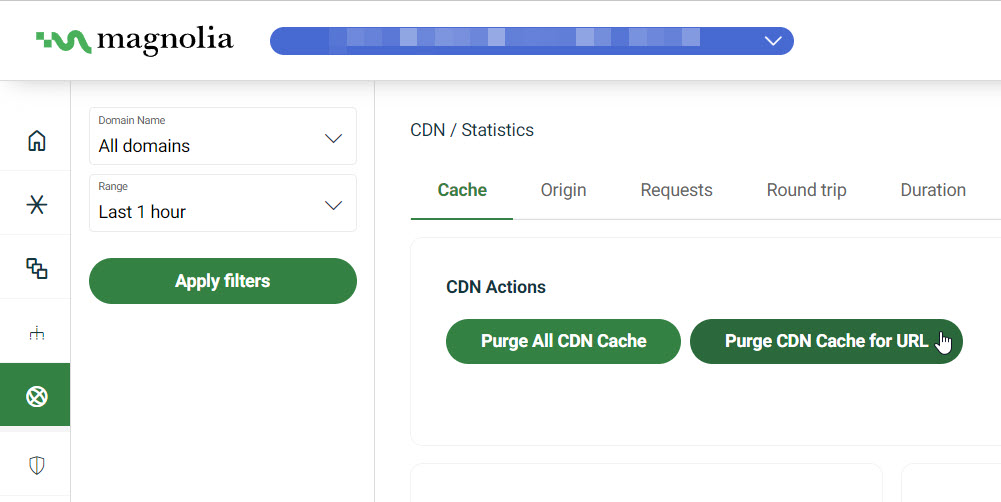
- Under CDN Actions, click Purge CDN Cache for URL.
-
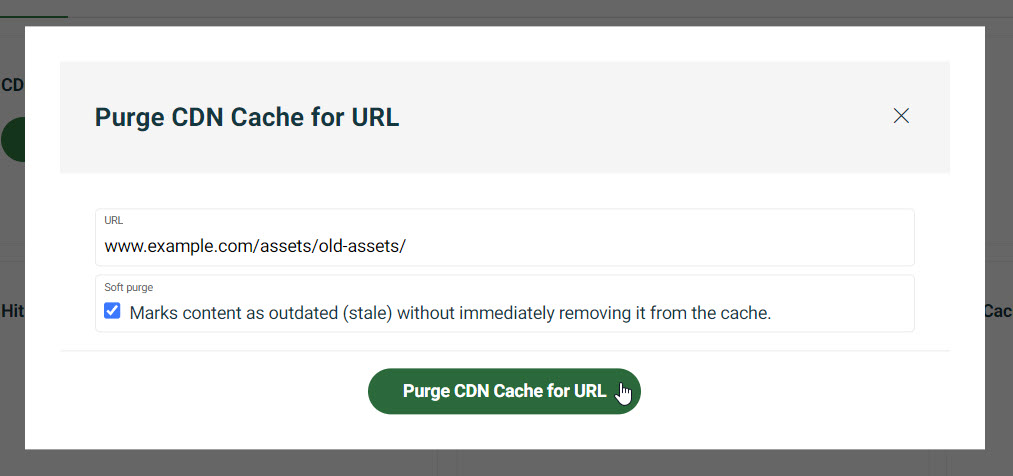
In the dialog, enter the URL of the object that you want to purge.
For example,
www.example.com/assets/old-assets/orwww.example.com/assets/old-assets/resource.extension. -
Optionally select Soft purge.
-
Click Purge CDN Cache for URL.
View stats
- Go to CDN > Statistics.
- Select the desired Domain from the dropdown list.
- Select the Range for the statistics.
- Click Apply filters.
When you Apply filters, the selection persists: if you reload the page, you see the same filter selection.
It also ensures you can share the selection and the recipient sees the same view as you do.
Example
https://cockpit.magnolia-platform.com/cdn/statistics?from=2026-03-06T16:25:31.842Z&to=2026-03-06T17:25:31.842Z&In this case, the URL shows CDN statistics for the selected date range.
Availability
View overall CDN availability. The average availability summarizes the period, while the time series shows changes over time.
This tab also includes Apdex score and Apdex score over time.
Apdex score (0-1) summarizes how satisfied users are with response times at this layer. The gauge is the average for the selected period. Apdex score over time plots the same score on a timeline against these bands:
- Unacceptable (0-0.49)
- Poor (0.49-0.69)
- Fair (0.69-0.84)
- Good (0.84-0.93)
- Excellent (0.93-1)
Cache
- Hit ratio: percentage of content requests the cache filled compared to requests received.
- Hit ratio over time: hit ratio expressed over a timeline.
- Cache coverage: percentage of cacheable requests compared to all requests (excludes
PASSrequests). - Cache statuses: cache statuses expressed as a percentage by category.
HIT: object was found in the cache.MISS: object was not found in the cache at the time of the query.PASS: request was flagged to not be cached.
- Cache coverage over time: cache coverage as a percentage over a timeline.
Origin
- Requests per zone: requests per geographic zone (map view).
- Requests per zone and host: requests per geographic zone and host.
Requests
- Total requests: number of total requests.
- Total requests last 24 hours: total requests in the last 24 hours.
- Total requests beginning of month: total requests since the beginning of the current month.
- Total requests per host: chart of total requests per host as a percentage.
- Requests total: request volumes on a timeline.
- Requests total per host: request volumes per host on a timeline.
- Requests rate: rate of requests per second on a timeline.
- Requests rate per host: rate of requests per second per host on a timeline.
Round trip
- Round trip: average time to get a response after initiating a network request.
- Round trip over last 24 hours: average round trip for the last 24 hours.
- Round trip since beginning of the month: average round trip since the beginning of the month.
- Round trip timeline: average round trip on a timeline.
- Round trip timeline per host: average round trip per host on a timeline.
Duration
- Request duration: how long requests take on a timeline.
- Request duration per status: request duration categorized by cache status (
HIT,MISS,PASS,UNKNOWN). - Request duration per host: request duration categorized by host.
Traffic
- Traffic: traffic volume in GB.
- Traffic over time: data transfer volume over a timeline.
- Traffic rate: rate of data transfer (for example MB/s) over a timeline.
- Traffic detail: data transfer broken down by body and header size over a timeline.
- Total traffic detail: total data transfer broken down by body and header size.
HTTP statuses
- Error rate: total percentage of errors.
- Error rate over last 24 hours: error rate over the last 24 hours.
- Error rate since beginning of month: error rate since the beginning of the month.
- HTTP statuses: breakdown of HTTP status codes returned (for example
200or503). - HTTP Info, Success: timeline of INFO (
206) and SUCCESS (200) responses. - HTTP redirects: redirect requests on a timeline by status code (for example
302or308). - HTTP errors: error requests on a timeline by status code (for example
404or503).
Each card has a What is this? section for metric details in the Cockpit.