

Cluster events
The Cluster events view lists diagnostic messages the platform records while it runs the containers for your Magnolia installation. Typical examples include pulling a container image, assigning a workload to a node, or a container starting or stopping.
Events are grouped by severity:
- Normal: routine lifecycle messages that confirm expected work.
- Warning: messages that may point to trouble, such as a container that failed to start or a resource that could not be scheduled.
Understanding these signals helps you confirm that deployments and scaling behave as expected, and when something degrades it gives you a chronological trail so you can narrow the cause before you dig into logs or support.
Select desired cluster
Select your desired cluster from the dropdown menu at the top of the Cockpit.

View cluster events
- If you have not already done so, select your desired cluster (see Select desired cluster).
- In the sidebar, click Infrastructure > Events.
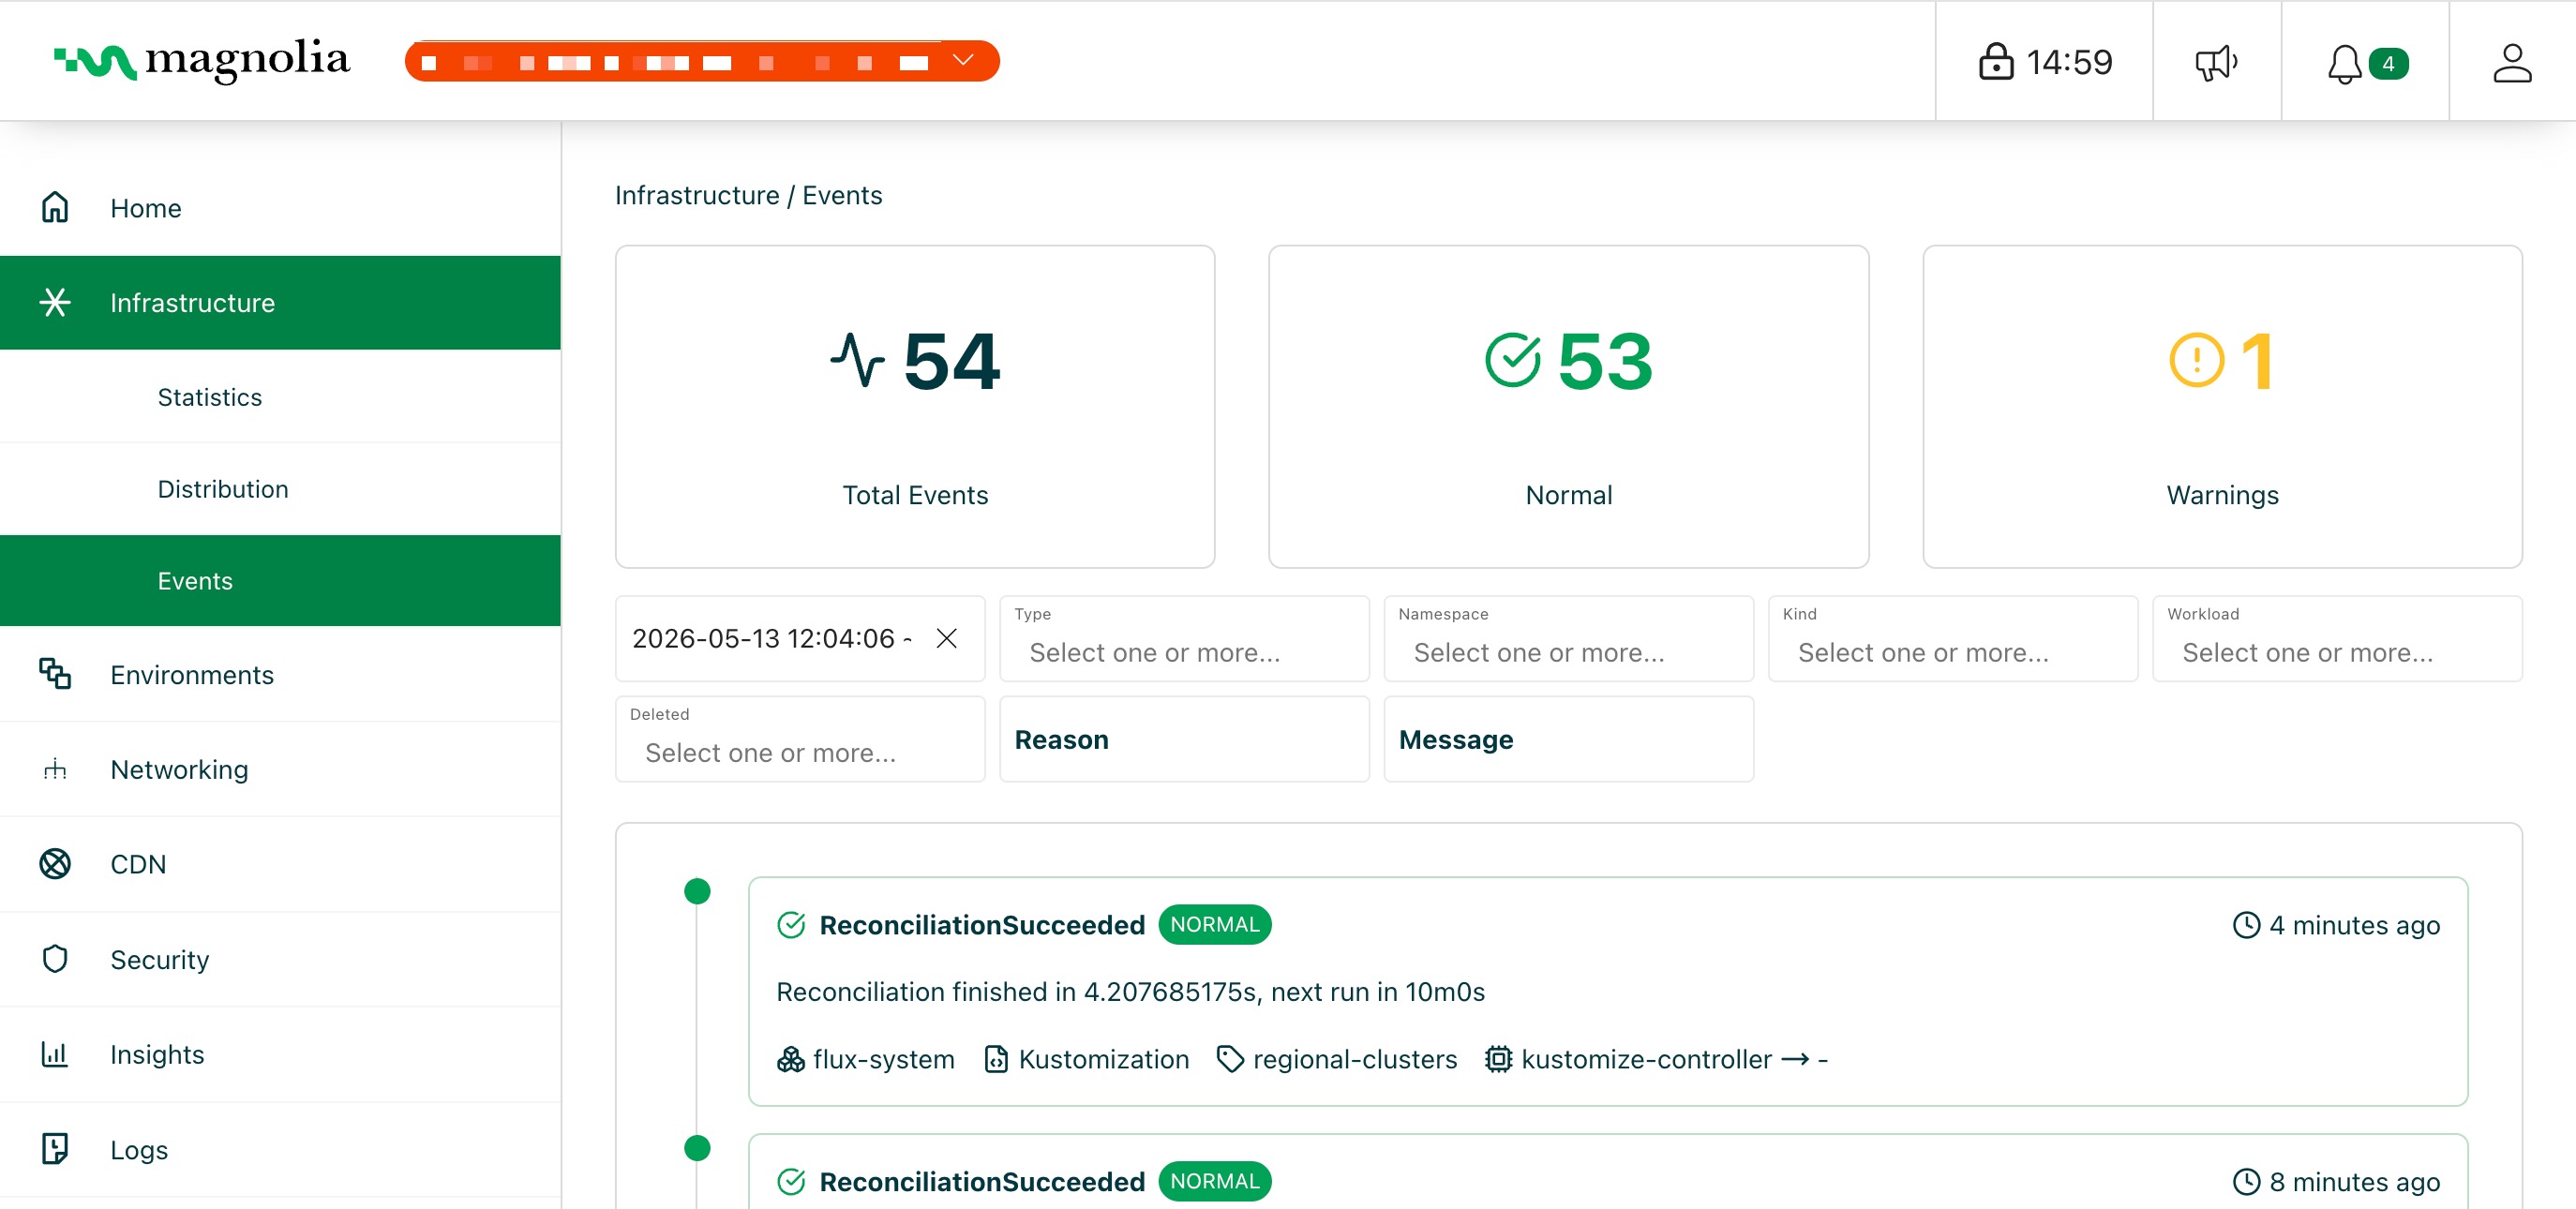
Summary metrics
At the top of the page, three figures summarize the events that match your current filters and time range.
Total events
The count of all matching events. Use it as a quick read on how much activity the cluster reported in the window you chose.
Normal
The count of routine Kubernetes-style lifecycle events (for example scheduling, image pull, or container start). A healthy share of Normal events usually means ordinary platform operations are moving forward.
Warning
The count of events that may reflect failures, pressure, or other degraded behavior. When you investigate availability or rollout issues, start with this figure and the Warning rows in the list below.
Filters
Use the filters to restrict events by time range, type, namespace, object kind, workload or object name, whether the object was deleted, reason, or message text. Narrowing the set is usually the fastest way to focus on one incident, one namespace, or one workload.
Event list
The list shows individual events with reason, message, affected object, and timestamps. Read it as a timeline to reconstruct what happened in order and to spot likely cause-and-effect chains (for example a scheduling warning shortly before restarts).