

Ingress traffic analysis
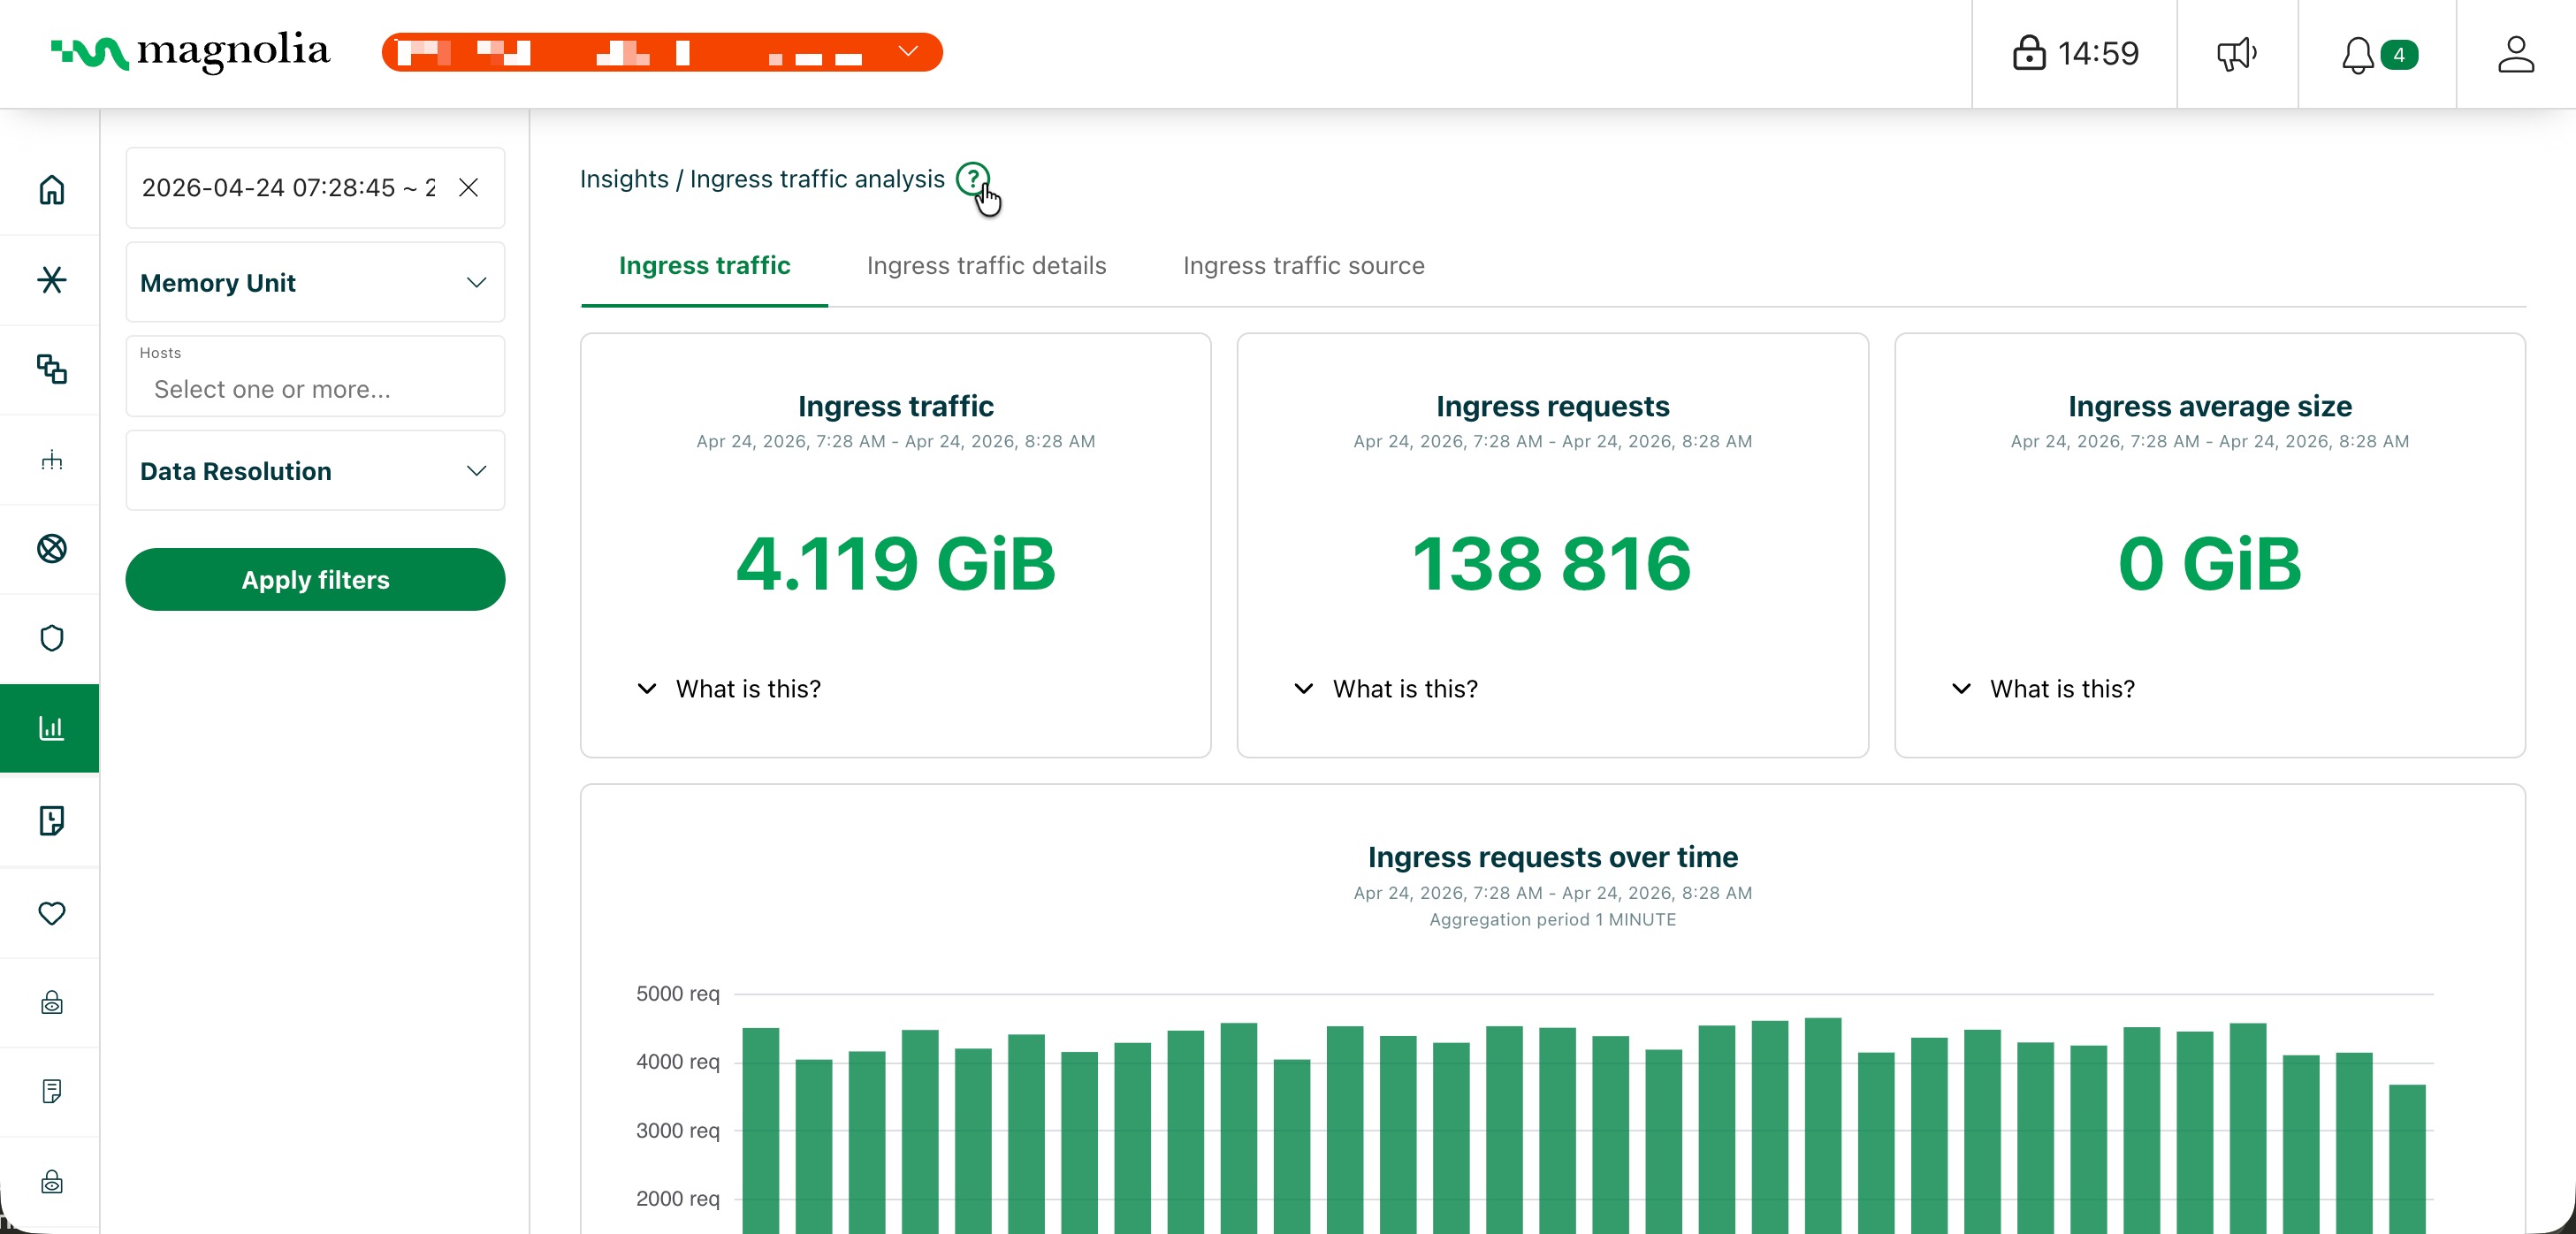
Use this page to analyze ingress traffic and troubleshoot issues at a glance. Tabs include Ingress traffic, Ingress traffic details, and Ingress traffic sources. Each tab has a What is this? section for metric details in the Cockpit.
Select desired cluster
Select your desired cluster from the dropdown menu at the top of the Cockpit.

Sidebar filters
Refine your view with:
- Date range: preset ranges or the calendar picker for custom dates
- Memory unit: IEC (
KiB,MiB,GiB,TiB, default) or SI (KB,MB,GB,TB) - Hosts: one or more hostnames or domains
- Data resolution: Minute, Hour, Day, Week, or Month
Click Apply filters to update the view.
Ingress traffic
Overall ingress traffic metrics:
- Traffic: total traffic volume and rate
- Requests: total number of requests
- Average size: average size of requests
- Requests rate over time: timeline of requests per unit of time
- Traffic over time: timeline of traffic volume over time
Ingress traffic details
Detailed ingress traffic metrics:
- Top paths: top paths by traffic volume
- Size ranges: size ranges by traffic volume
- Methods: methods by traffic volume
- Statuses: statuses by traffic volume
- Bot-to-Human ratio: ratio of bot requests to human requests
- Agent types: agent types by traffic volume
Ingress traffic sources
Sources of ingress traffic:
- Top IPs: top IPs by traffic volume
- Top user agents: top user agents by traffic volume
Where a user agent appears, you can open its details in the Cockpit. The result is a decoded view of the client, such as device and browser class, along with related signals that can help you tell typical browsers from automated or unusual traffic.