

Infrastructure statistics
The Infrastructure Statistics section displays information on Memory, CPU, and Storage for your DX Cloud project. Use this page to monitor infrastructure performance and troubleshoot issues at a glance.
This includes:
Select desired cluster
Select your desired cluster from the dropdown menu at the top of the Cockpit.

Memory
The Infrastructure Statistics Memory tab displays memory usage and trends for your infrastructure. Hover over the chart for details or click and drag to focus on a more focused period of time.
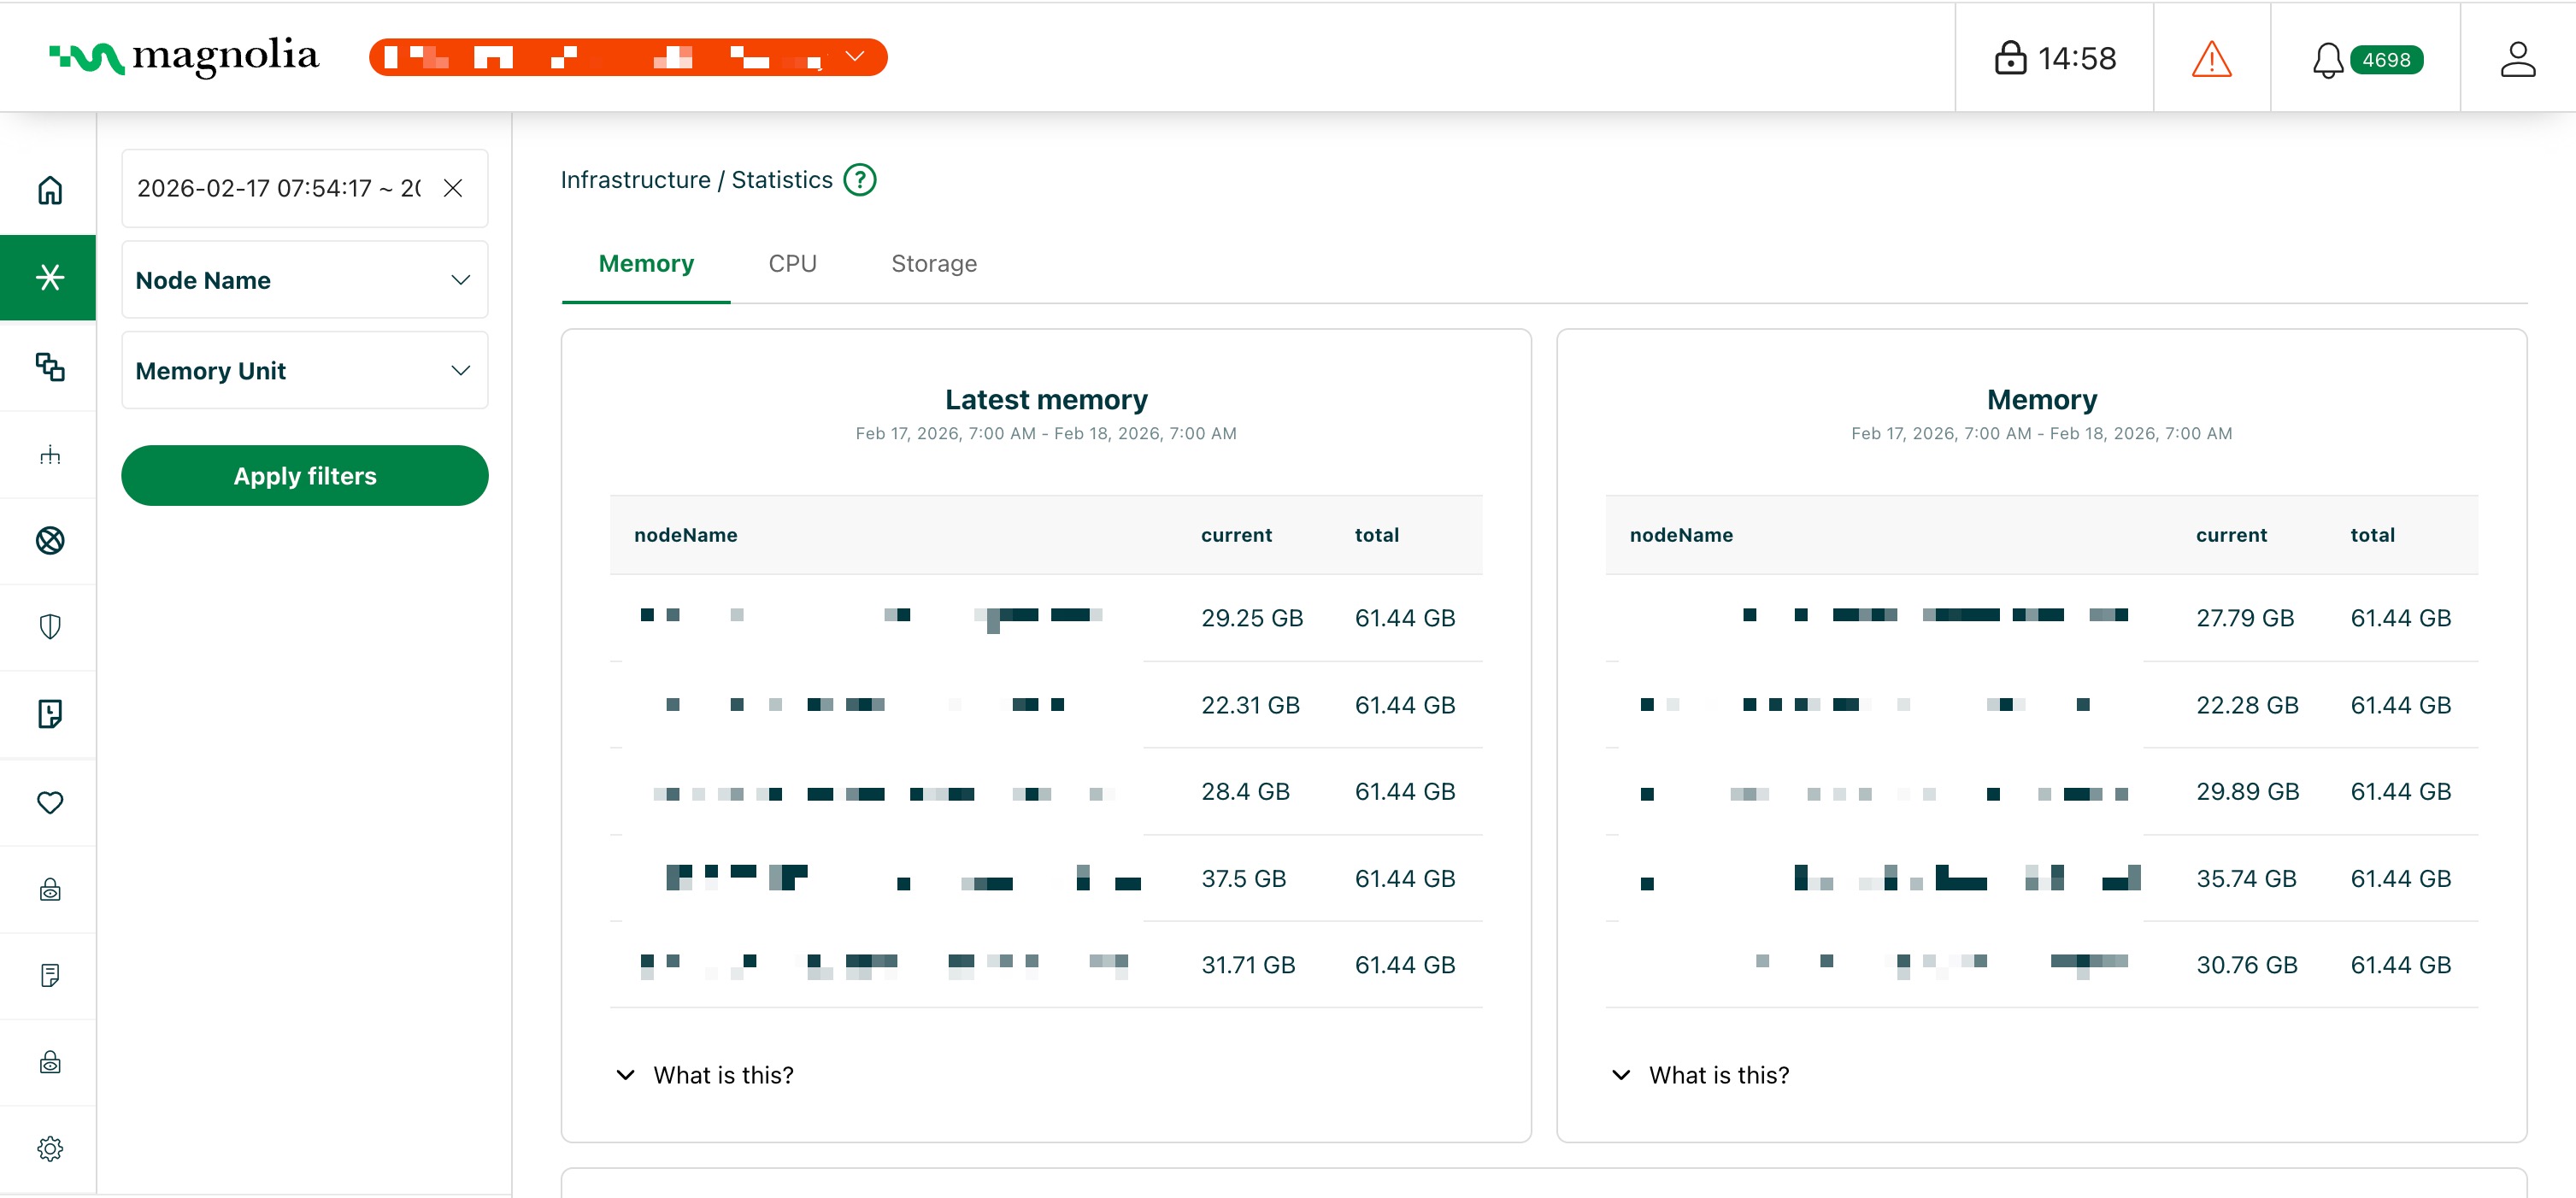
Latest memory
The current memory usage for the node.
- What is this? The current RAM usage for this Kubernetes node in your cluster. This represents the total memory consumed by all workloads running on the node, including Magnolia pods, system components, and other services.
- Why it matters: High memory usage on a node limits the capacity available for your DXP platform workloads. When nodes run low on memory, Kubernetes may throttle or evict pods, which can cause Magnolia instances to become unresponsive, slow down content delivery, or interrupt authoring workflows. Monitoring node memory helps ensure your infrastructure has sufficient capacity to support your platform’s operations.
Memory
The average memory usage for the node.
- What is this? The average RAM consumption over the selected time period for this Kubernetes node, representing typical memory usage across all workloads running on the node.
- Why it matters: Understanding average memory usage helps you identify if your node capacity matches your platform’s needs. Sustained high averages indicate your infrastructure is operating near capacity, which may require adding nodes or scaling up node resources to maintain performance. Low averages suggest you have headroom for growth or could optimize resource allocation.
Memory over time
Timeline showing memory usage trends for the node.
- What is this? A time-series graph displaying how memory consumption has changed over time on this Kubernetes node, showing patterns related to workload activity, traffic patterns, or resource-intensive operations.
- Why it matters: Memory trends reveal when your infrastructure is under pressure, during peak traffic periods, content publishing workflows, or when running resource-intensive operations. Identifying these patterns helps you plan infrastructure capacity, schedule maintenance, and ensure your nodes can handle both routine operations and traffic spikes without impacting your DXP platform’s performance.
Free memory over time
The free memory for the node.
- What is this? The amount of available RAM on this Kubernetes node that can be allocated to new pods or used by existing workloads when they need additional resources.
- Why it matters: Low free memory means your infrastructure has limited capacity to handle increased load, new pod deployments, or traffic spikes. This can prevent Kubernetes from scheduling new workloads, cause pod evictions, and degrade performance across your DXP platform. Monitoring free memory helps ensure your infrastructure can scale to meet demand without impacting content delivery or authoring operations.
CPU
The Infrastructure Statistics CPU tab displays CPU usage and trends for your infrastructure. Hover over the chart for details or click and drag to focus on a more focused period of time.
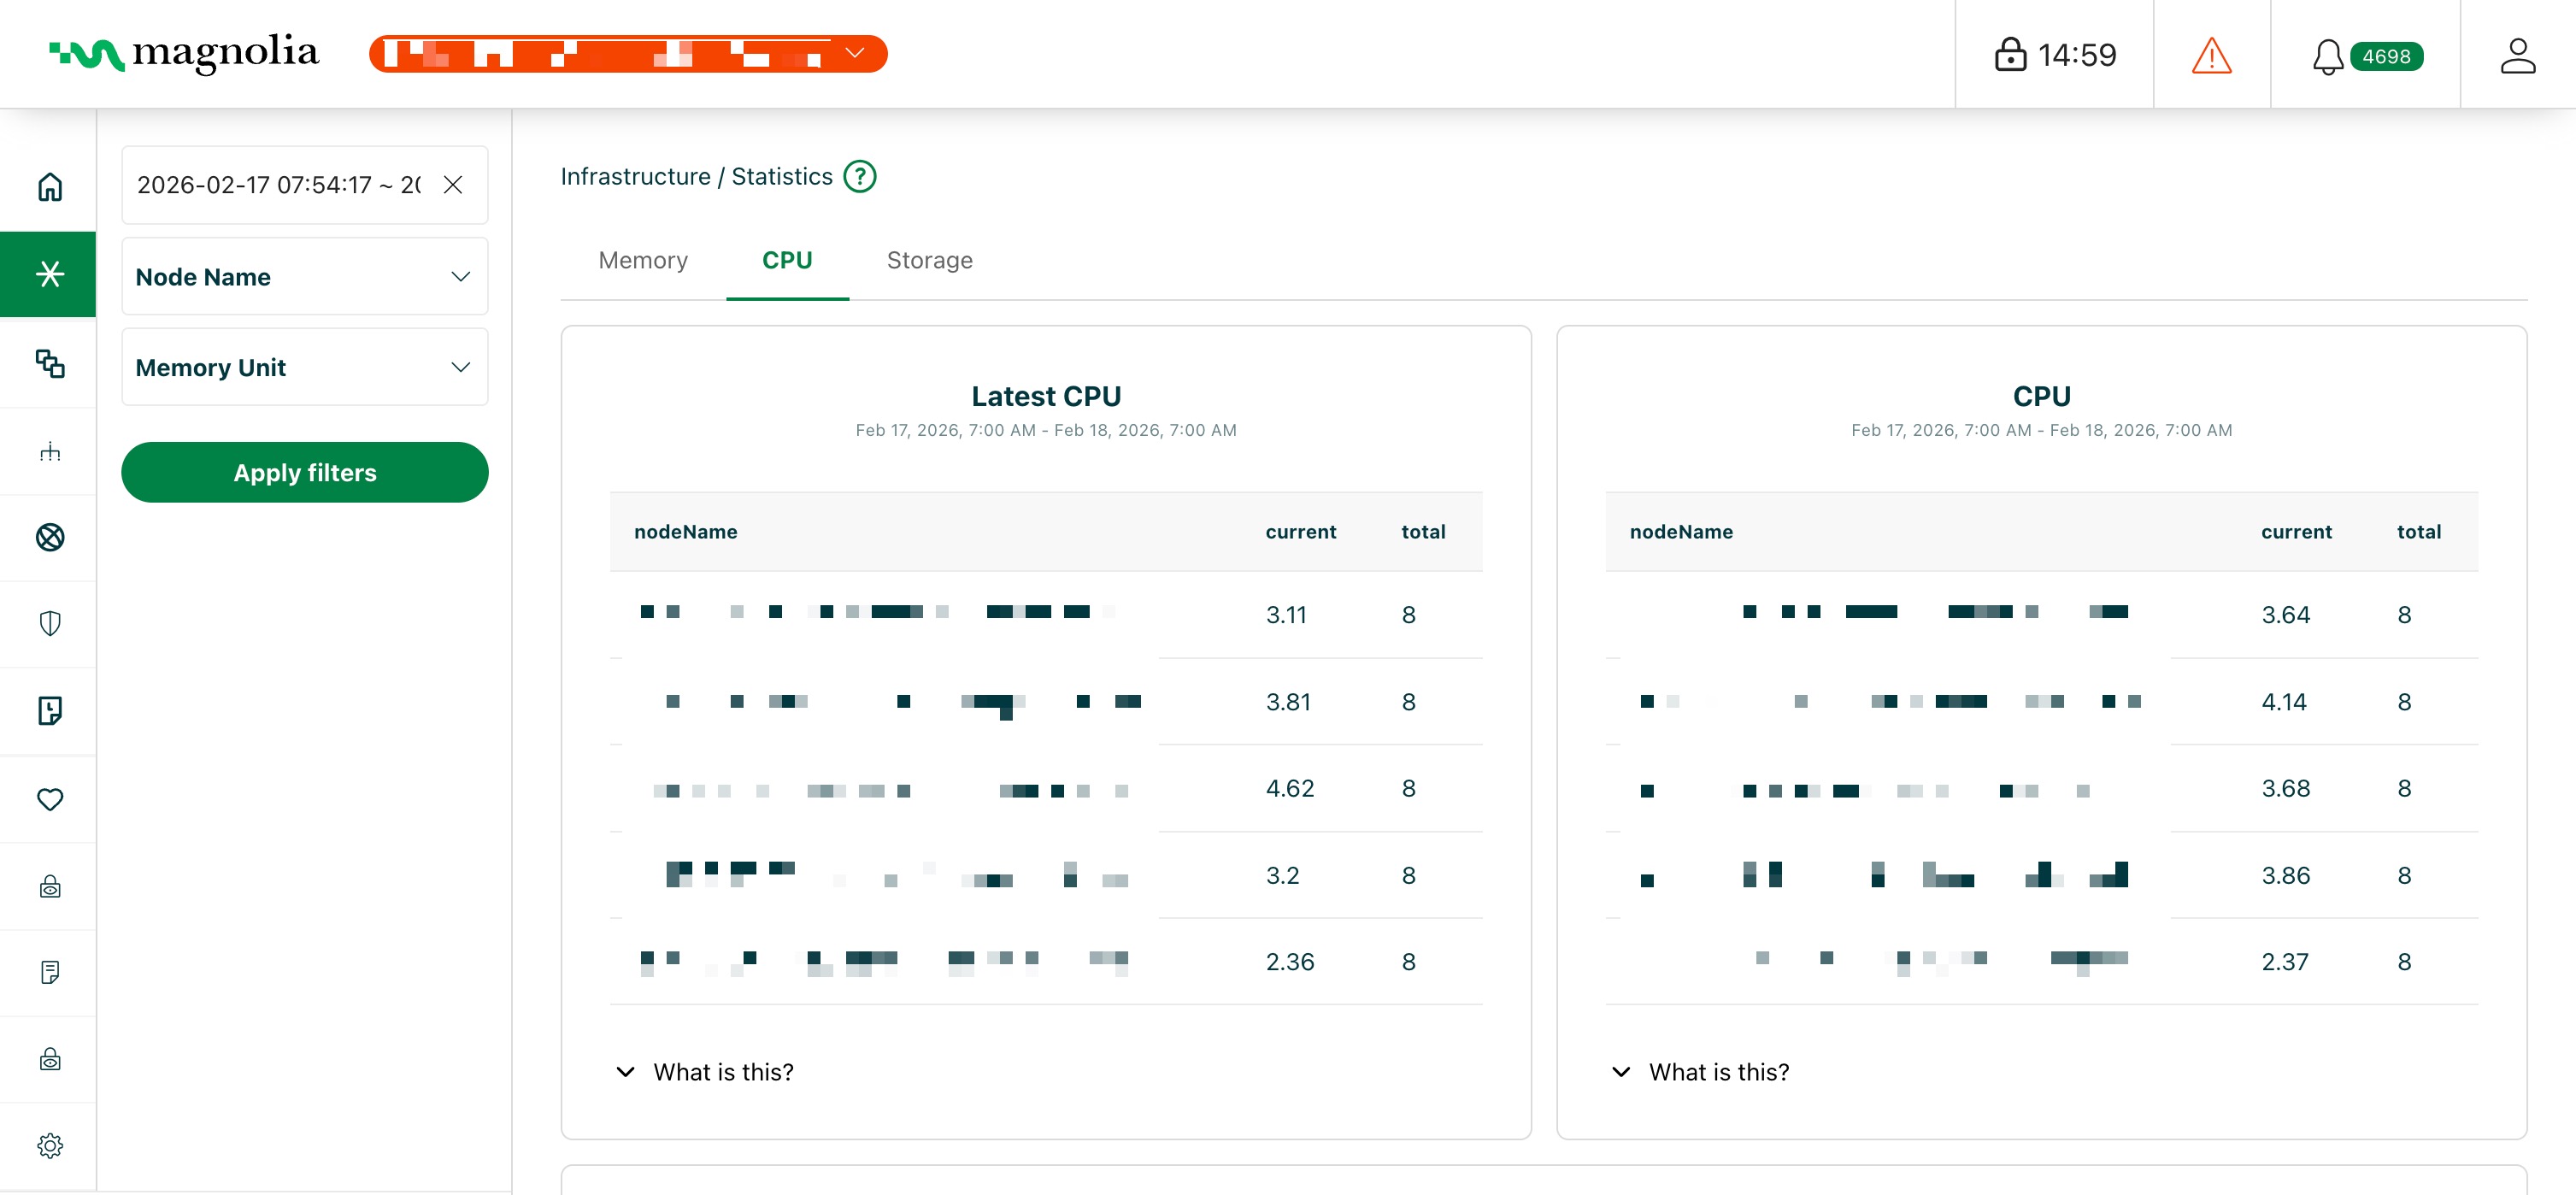
Latest CPU
The current CPU usage for the node.
- What is this? The current processor utilization for this Kubernetes node, showing how much CPU is being used by all workloads running on the node, including Magnolia pods and system processes.
- Why it matters: High CPU usage on a node limits processing capacity available for your DXP platform workloads. When nodes are CPU-constrained, workloads may experience slower response times, delayed content rendering, and reduced ability to handle concurrent requests. This directly impacts both website visitors and content authors using your platform.
CPU
The average CPU usage for the node.
- What is this? The average processor utilization over the selected time period for this Kubernetes node, representing typical CPU load across all workloads.
- Why it matters: Understanding average CPU helps you assess if your node resources match your platform’s processing needs. Consistently high averages suggest your infrastructure is working at capacity, which may require adding nodes or upgrading node resources to maintain performance. Low averages indicate you have processing headroom for growth or could optimize costs through right-sizing.
CPU over time
Timeline showing CPU usage trends for the node.
- What is this? A time-series graph displaying how CPU utilization has changed over time on this Kubernetes node, correlating with workload activity, traffic patterns, or resource-intensive operations.
- Why it matters: CPU trends help you understand when your infrastructure is under stress, during peak traffic, content publishing operations, or when running intensive tasks. Identifying these patterns helps you optimize workload scheduling, plan infrastructure capacity, and ensure your nodes can handle both routine operations and peak demand without degrading your DXP platform’s performance.
Free CPU over time
The free CPU for the node.
- What is this? The available CPU capacity on this Kubernetes node that can be allocated to new pods or used by existing workloads when they need additional processing power.
- Why it matters: Low free CPU means your infrastructure has limited capacity to handle increased load, new deployments, or traffic spikes. This can prevent Kubernetes from scheduling new workloads, cause performance throttling, and degrade response times across your DXP platform. Monitoring free CPU helps ensure your infrastructure can scale to meet demand without impacting content delivery or authoring workflows.
Storage
The Infrastructure Statistics Storage tab displays storage usage and trends for your infrastructure. Hover over the chart for details or click and drag to focus on a more focused period of time.
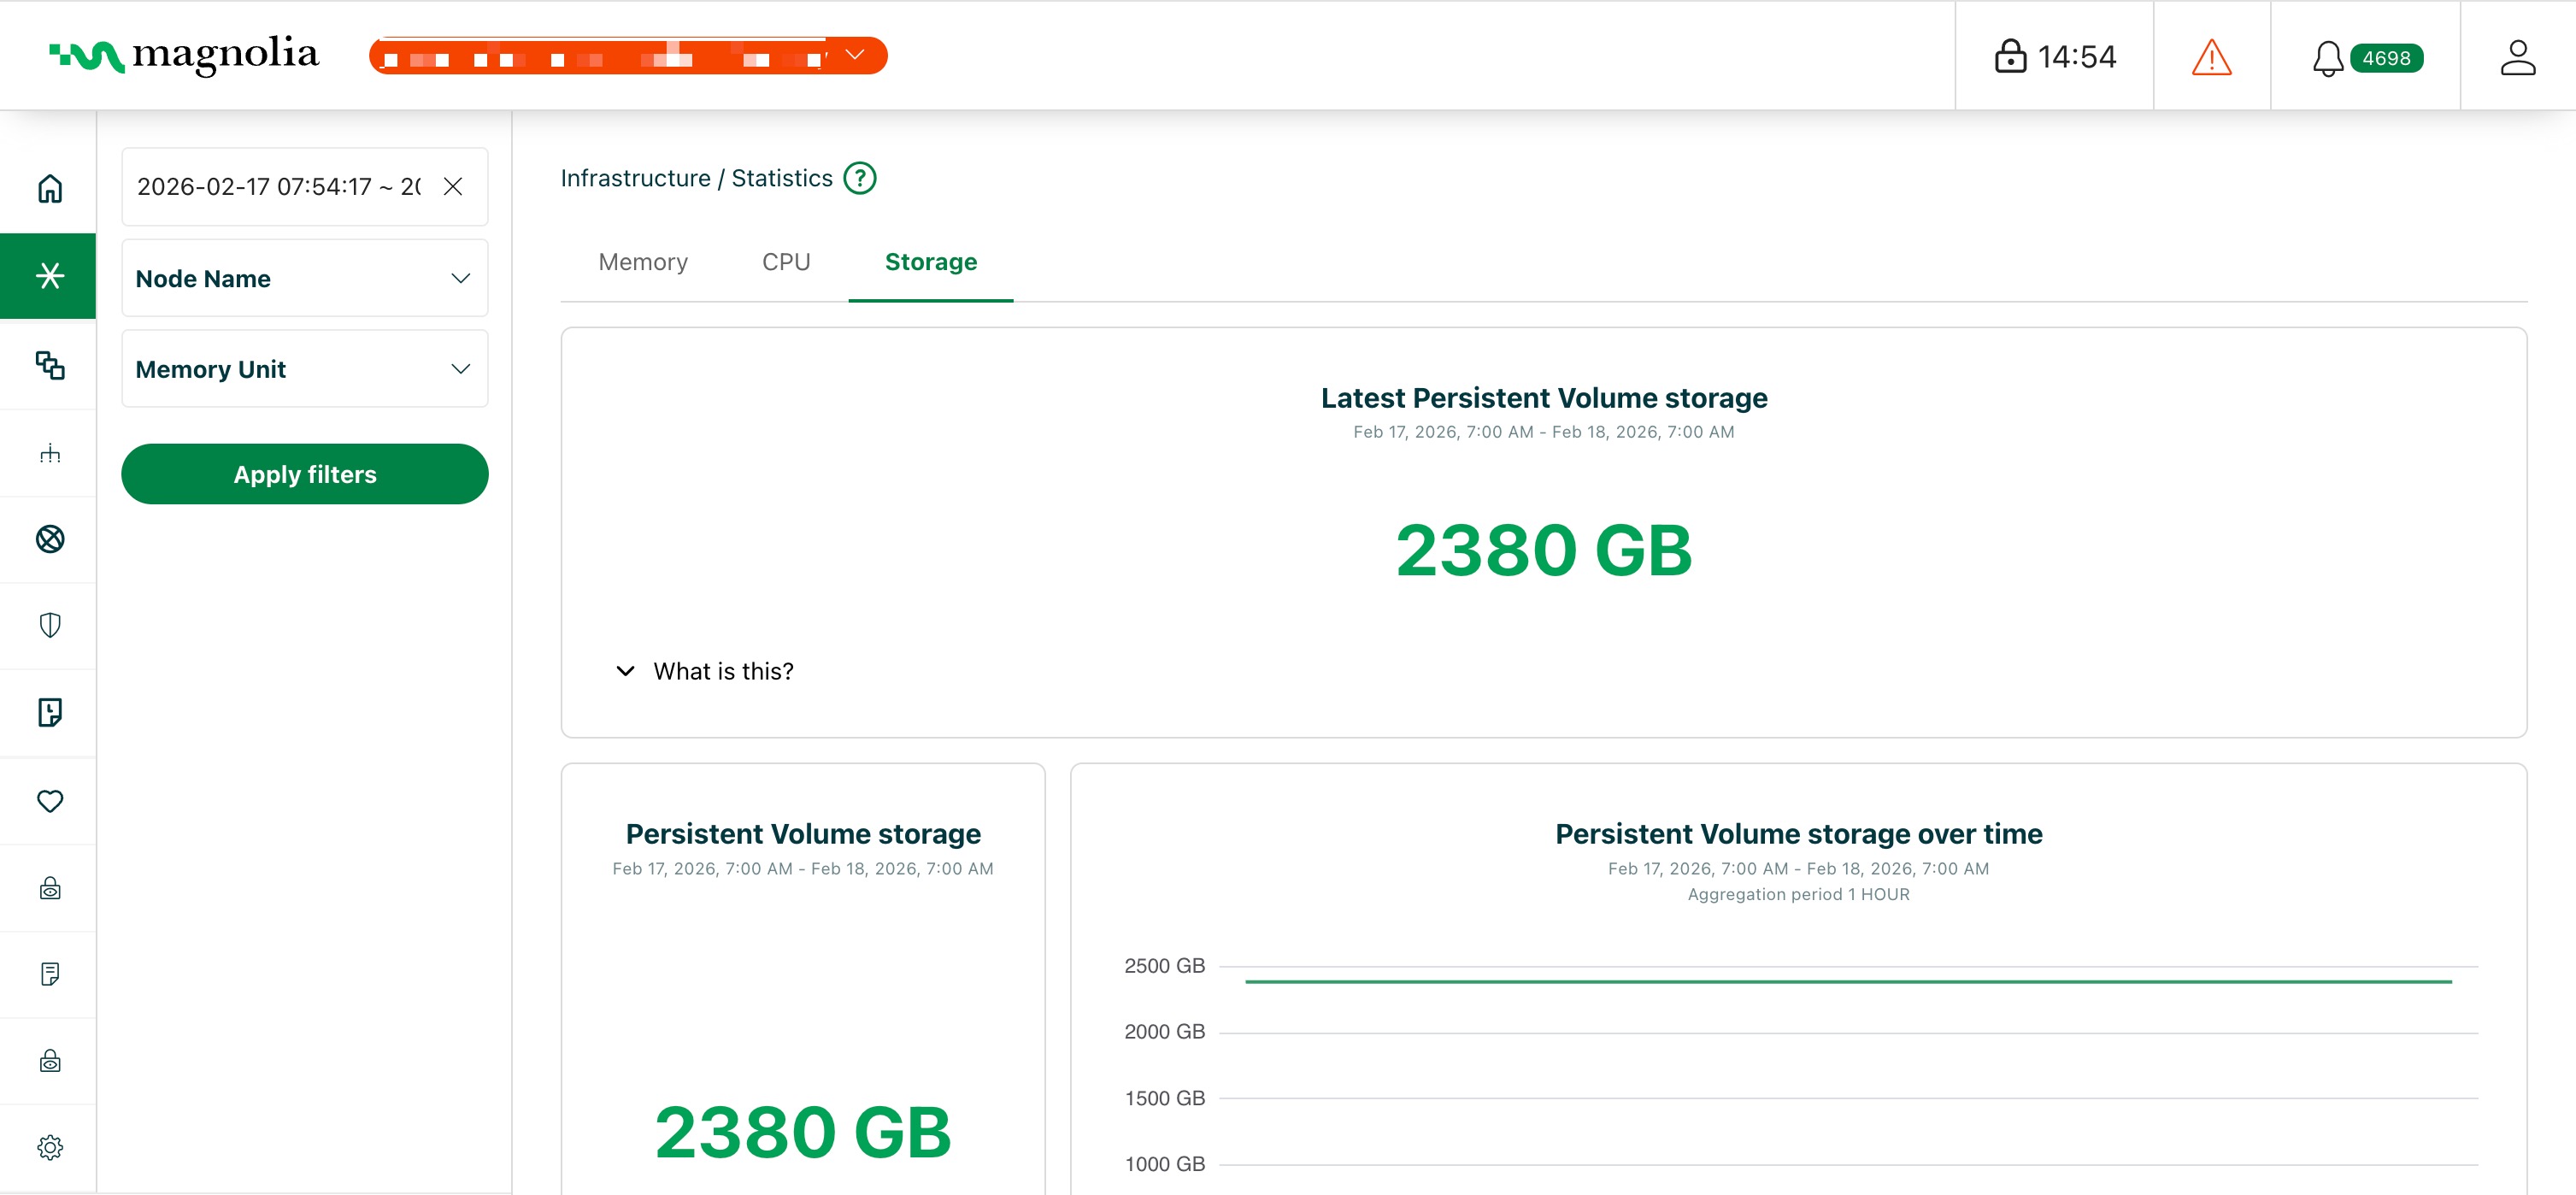
Latest Persistent Volume storage
The current Persistent Volume storage usage for the cluster.
- What is this? The current storage usage for persistent volumes across your cluster. These volumes store data that persists beyond pod lifecycles, including your Magnolia content repository, digital assets, databases, and application data.
- Why it matters: Persistent volume storage contains critical platform data. Running low on space can prevent new data writes, block content publishing operations, cause pod failures, and potentially lead to data loss if the system cannot write updates. Monitoring this helps ensure your infrastructure has sufficient storage capacity for content growth and can plan expansion before hitting limits that disrupt platform operations.
Persistent Volume storage
The average Persistent Volume storage usage for the cluster.
- What is this? The average storage consumption over the selected time period for persistent volumes across your cluster, representing typical storage usage for your platform’s persistent data.
- Why it matters: Understanding average storage usage helps you track data growth trends and plan infrastructure capacity. If storage is growing rapidly, you may need to expand storage volumes, implement data archival strategies, or optimize data management before reaching capacity limits that could interrupt platform operations.
Persistent Volume storage over time
Timeline showing Persistent Volume storage usage trends for the cluster.
- What is this? A time-series graph displaying how persistent volume storage has changed over time across your cluster, showing data growth patterns, the impact of content migrations or imports, and storage consumption trends.
- Why it matters: Storage trends reveal how quickly your platform’s persistent data is growing. Rapid growth may indicate heavy content creation, large asset uploads, or the need for data archival strategies. Understanding these patterns helps you plan storage capacity, optimize data management, and prevent storage-related issues before they impact platform operations.
Latest system storage
The system storage usage for the cluster.
- What is this? The current storage usage for system-level data across your cluster, including container logs, temporary files, container images, and Kubernetes system data. This is separate from persistent volumes that store application data.
- Why it matters: System storage fills up with logs and temporary files over time. If it runs out, it can prevent log writing, cause application errors, prevent new pod deployments, and potentially impact your platform’s ability to operate normally. Regular monitoring helps identify when log rotation, cleanup, or storage expansion is needed to maintain infrastructure health.
System storage
The average system storage usage for the cluster.
- What is this? The average storage consumption over the selected time period for system-level storage across your cluster, including logs, temporary files, and container system data.
- Why it matters: Understanding average system storage helps you identify if logs are accumulating faster than expected, which could indicate increased error rates, verbose logging, or the need for log retention policy adjustments. This helps you optimize system storage usage and ensure it doesn’t fill up unexpectedly, which could disrupt platform operations.
System storage over time
Timeline showing system storage usage trends for the cluster.
- What is this? A time-series graph displaying how system storage has changed over time across your cluster, showing log accumulation patterns, temporary file growth, and system data trends.
- Why it matters: System storage trends help you understand log growth patterns and identify when cleanup, log rotation, or storage expansion is needed. Sudden increases may indicate application issues generating excessive logs or the need for log management optimization. Monitoring these trends ensures your infrastructure maintains healthy system storage levels and prevents storage-related operational issues.