

Magnolia database
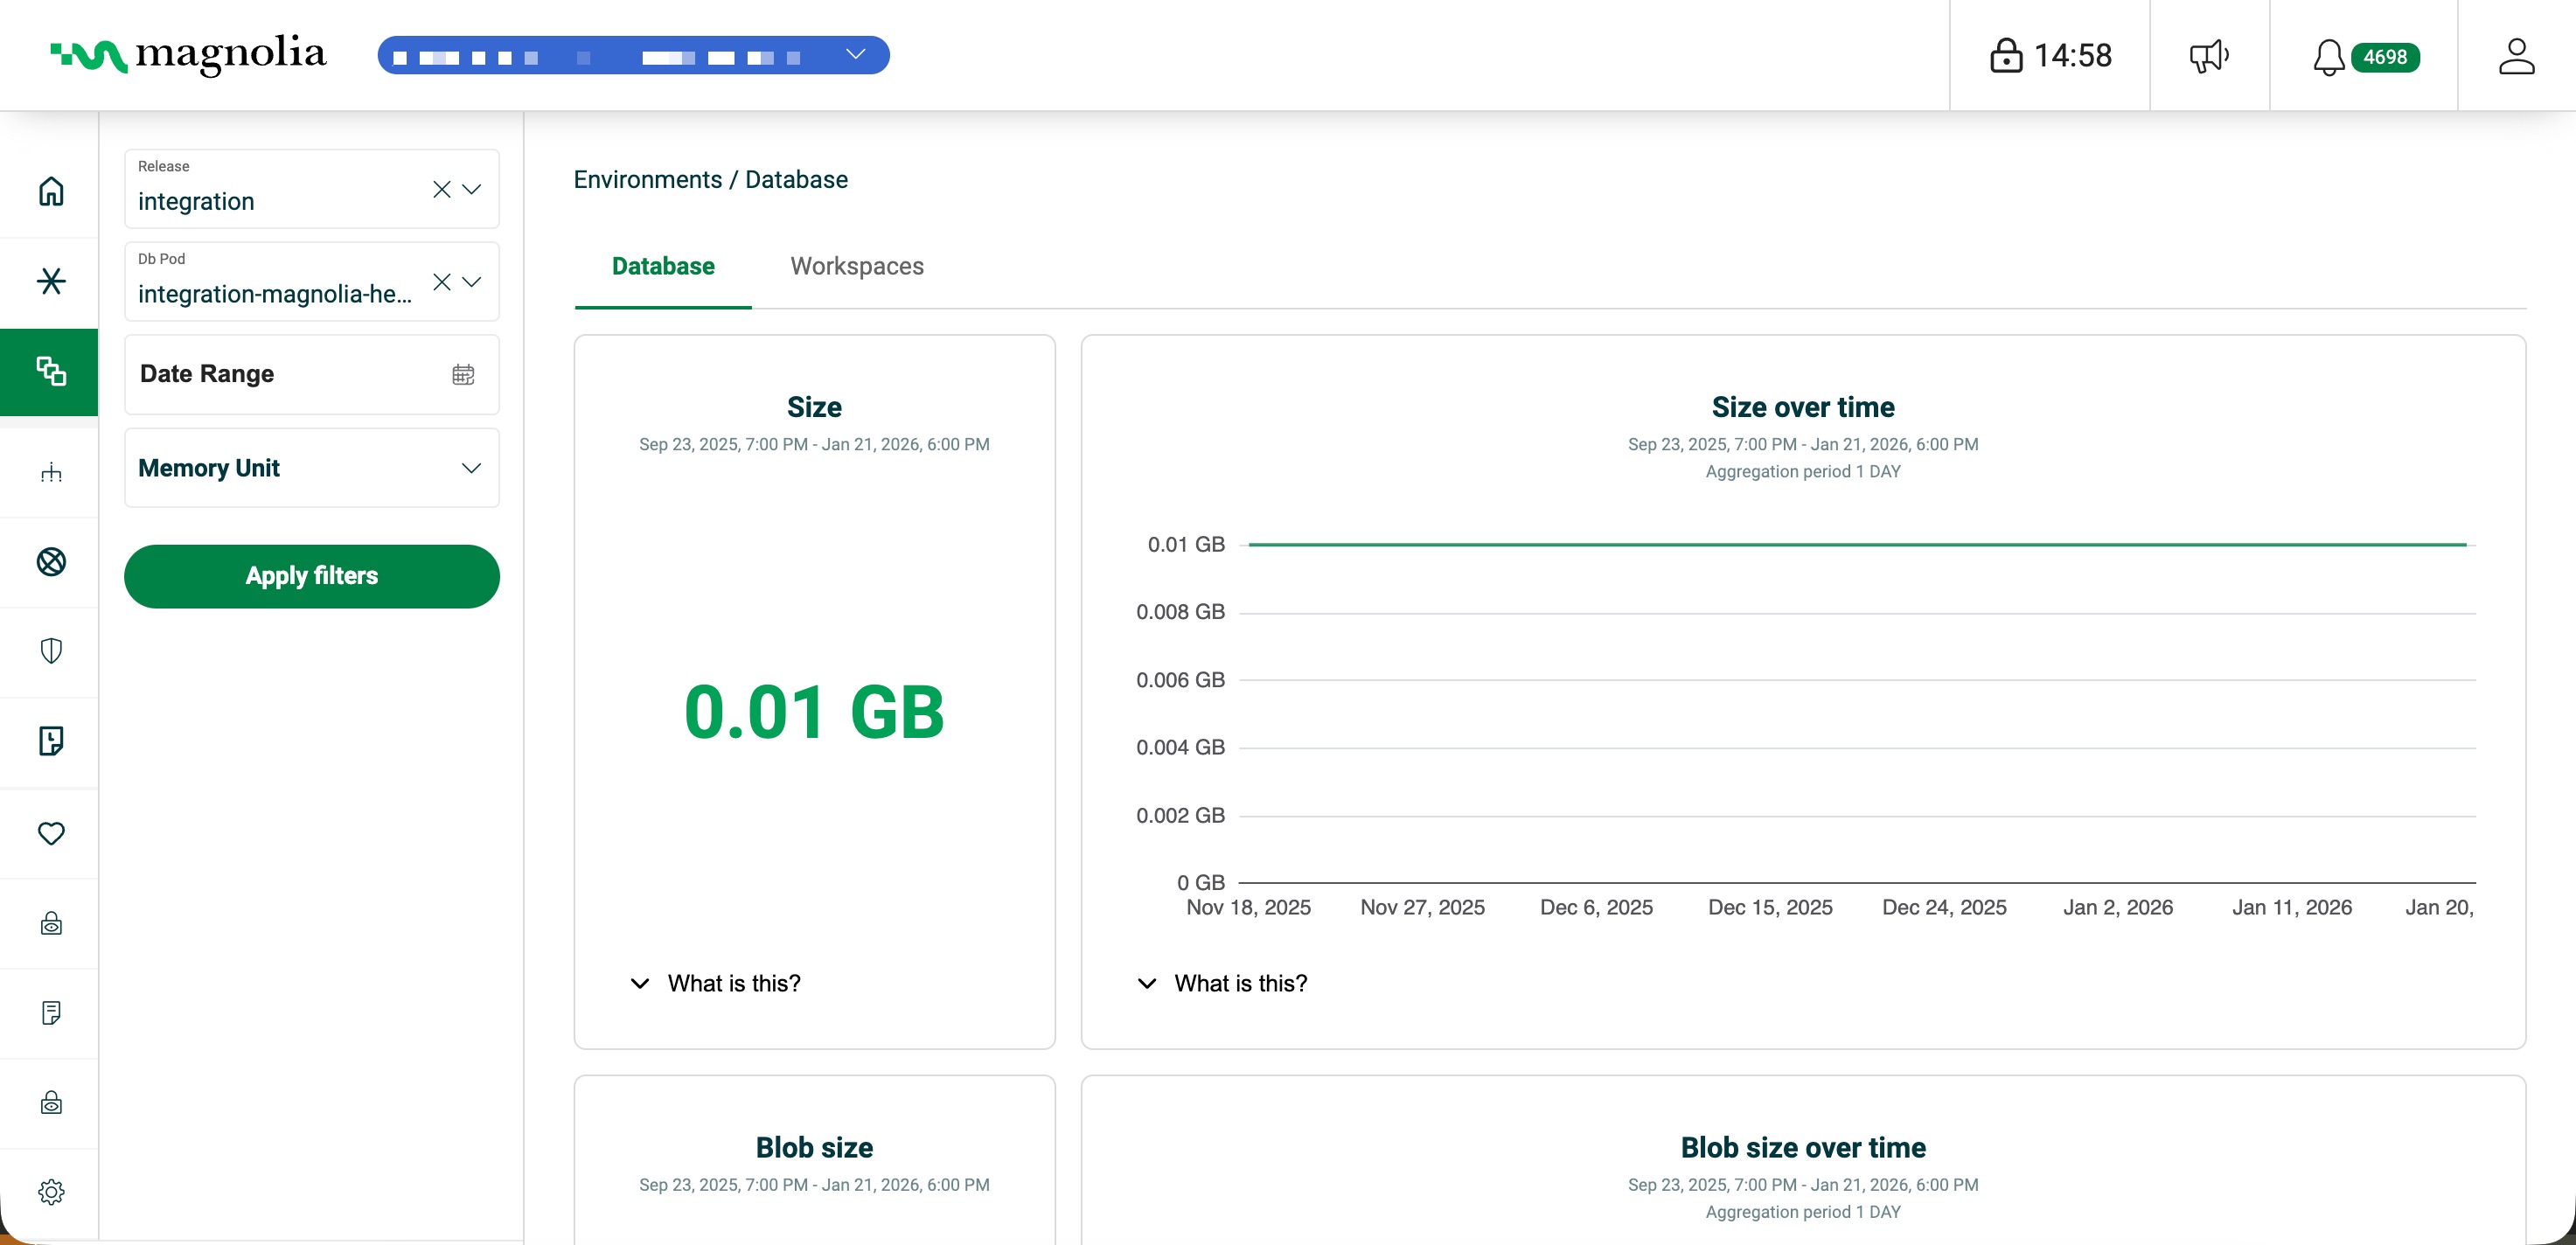
The Magnolia Database section displays metrics related to your Magnolia PostgreSQL database and JCR workspaces. Use this dashboard to monitor database size, binary storage, cache performance, and per-workspace storage details.
Select your desired Release and Pod from the sidebar filters as the metrics displayed are specific to these selections.
Select desired cluster
Select your desired cluster from the dropdown menu at the top of the Cockpit.

Sidebar filters
The sidebar filters allow you to refine your view by selecting specific criteria.
- Release: select the namespace to analyze (typically
prodordev). - Pod: select the specific pod instance to analyze (for example
dev-magnolia-helm-author-db-0). - Date range: select the time period using preset ranges or the calendar picker for custom dates.
- Memory unit: choose how to display storage sizes (
KiB,MiB,GiB, orTiB).
Click Apply filters to update the view.
Database
View overall database health and performance metrics.
- Total size: current database size and growth trends over time.
- Binary size: storage used by assets, documents, and other large records.
- Average binary size: typical size of individual binary records.
- Cache ratio: database cache efficiency; higher values indicate better performance.
Workspaces
Examine storage metrics for each JCR workspace.
The table shows records, total size, table size, index size, and dead tuples for each workspace, sorted alphabetically.
Click any metric value to view a detailed time series chart for that workspace.
Memory
Monitor heap memory usage for the Magnolia DXP database on this environment.
Charts show current and average used and free memory, with time series to spot trends and pressure. Use this to plan scaling or tune database settings if usage is high.
CPU
Monitor CPU usage for the Magnolia DXP database container.
Snapshots and time series show how load varies over time; correlate with authoring, publication, or sync activity. Use this to optimize heavy operations or scale CPU on the platform.
Storage
Monitor disk space on the persistent volume used by the Magnolia DXP database.
Used, available, and total capacity are shown with time series so you can avoid filling the volume and plan resizing. Reduce usage (for example VACUUM, prune blobs) or request a larger volume if space is low.
Backup storage
Monitor the space and number of backup artifacts for the Magnolia DXP database.
Size and object count help you stay within platform storage quota and tune retention or backup frequency. Use trends to plan before approaching limits.