

Ingress request logs
Ingress request logs display log information from Kubernetes Ingresses.
Select desired cluster
Select your desired cluster from the dropdown menu at the top of the Cockpit.

View Ingress request logs
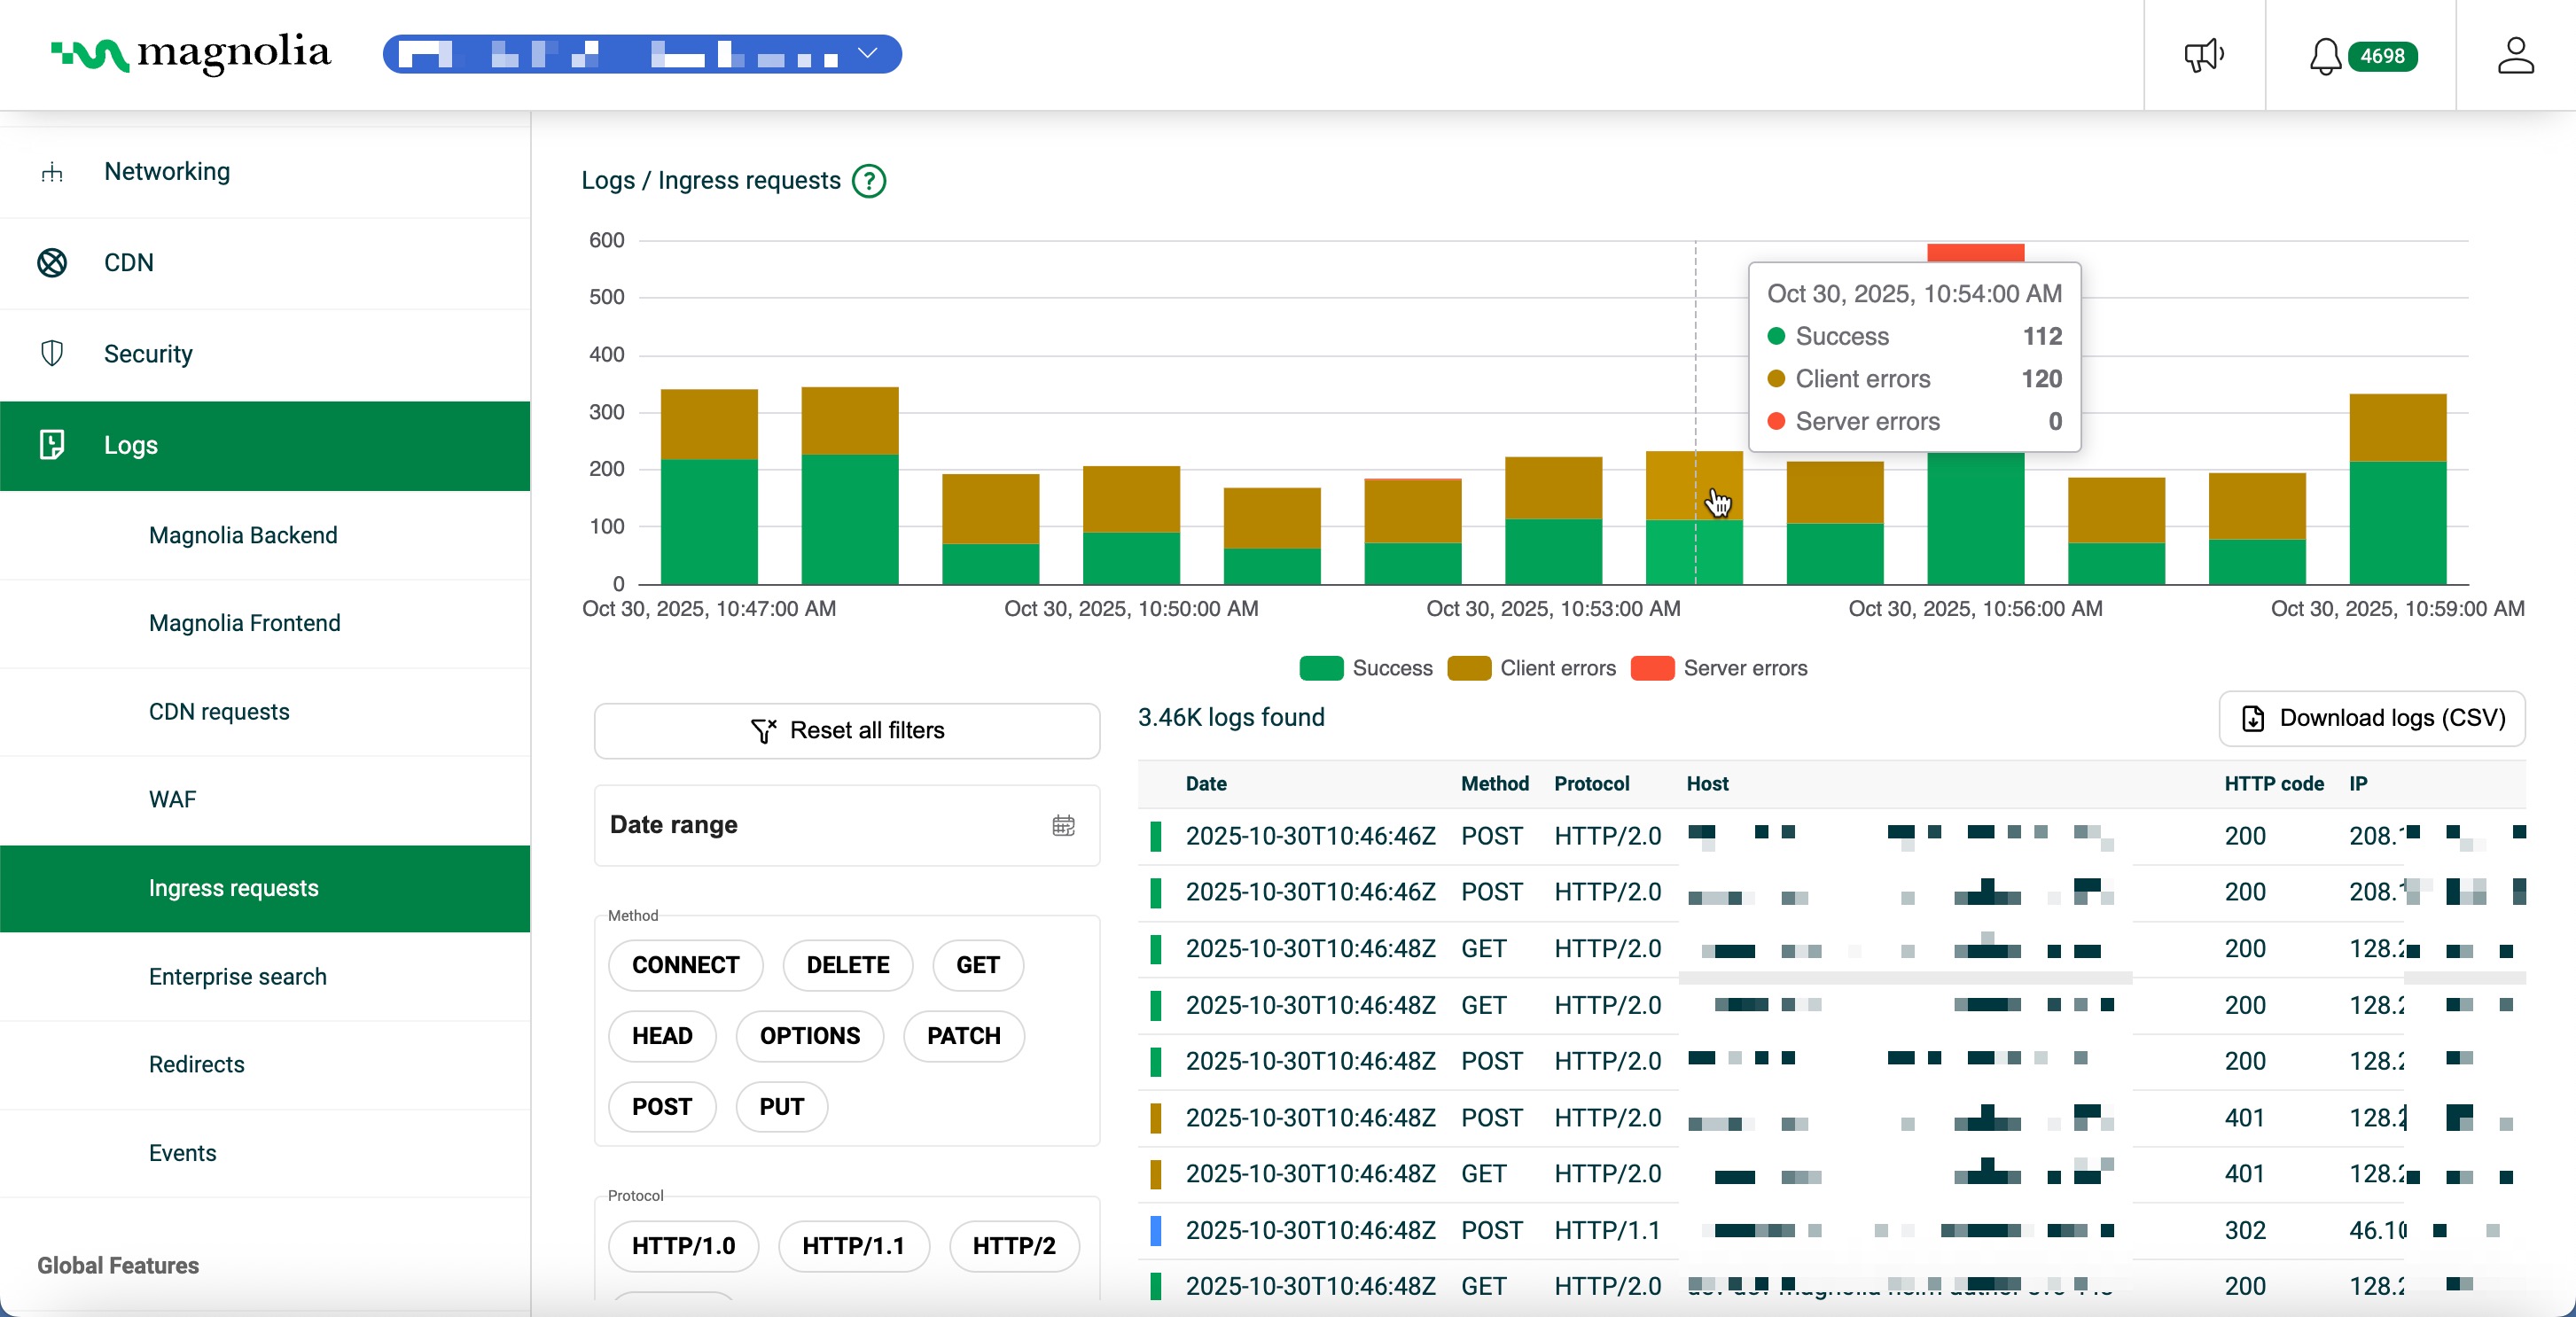
From Logs > Ingress requests:
- Select your desired cluster.
- View the chart to see Success (green), Client errors (yellow), and Server errors (red).
- In Filters, set date range, method, protocol, hosts, HTTP codes, IPs, paths, query parameters, backend service, namespace, RTT, size, request time, user agent, and request ID.
Details table
Click Download logs (CSV) to export the rows that match your current filters.
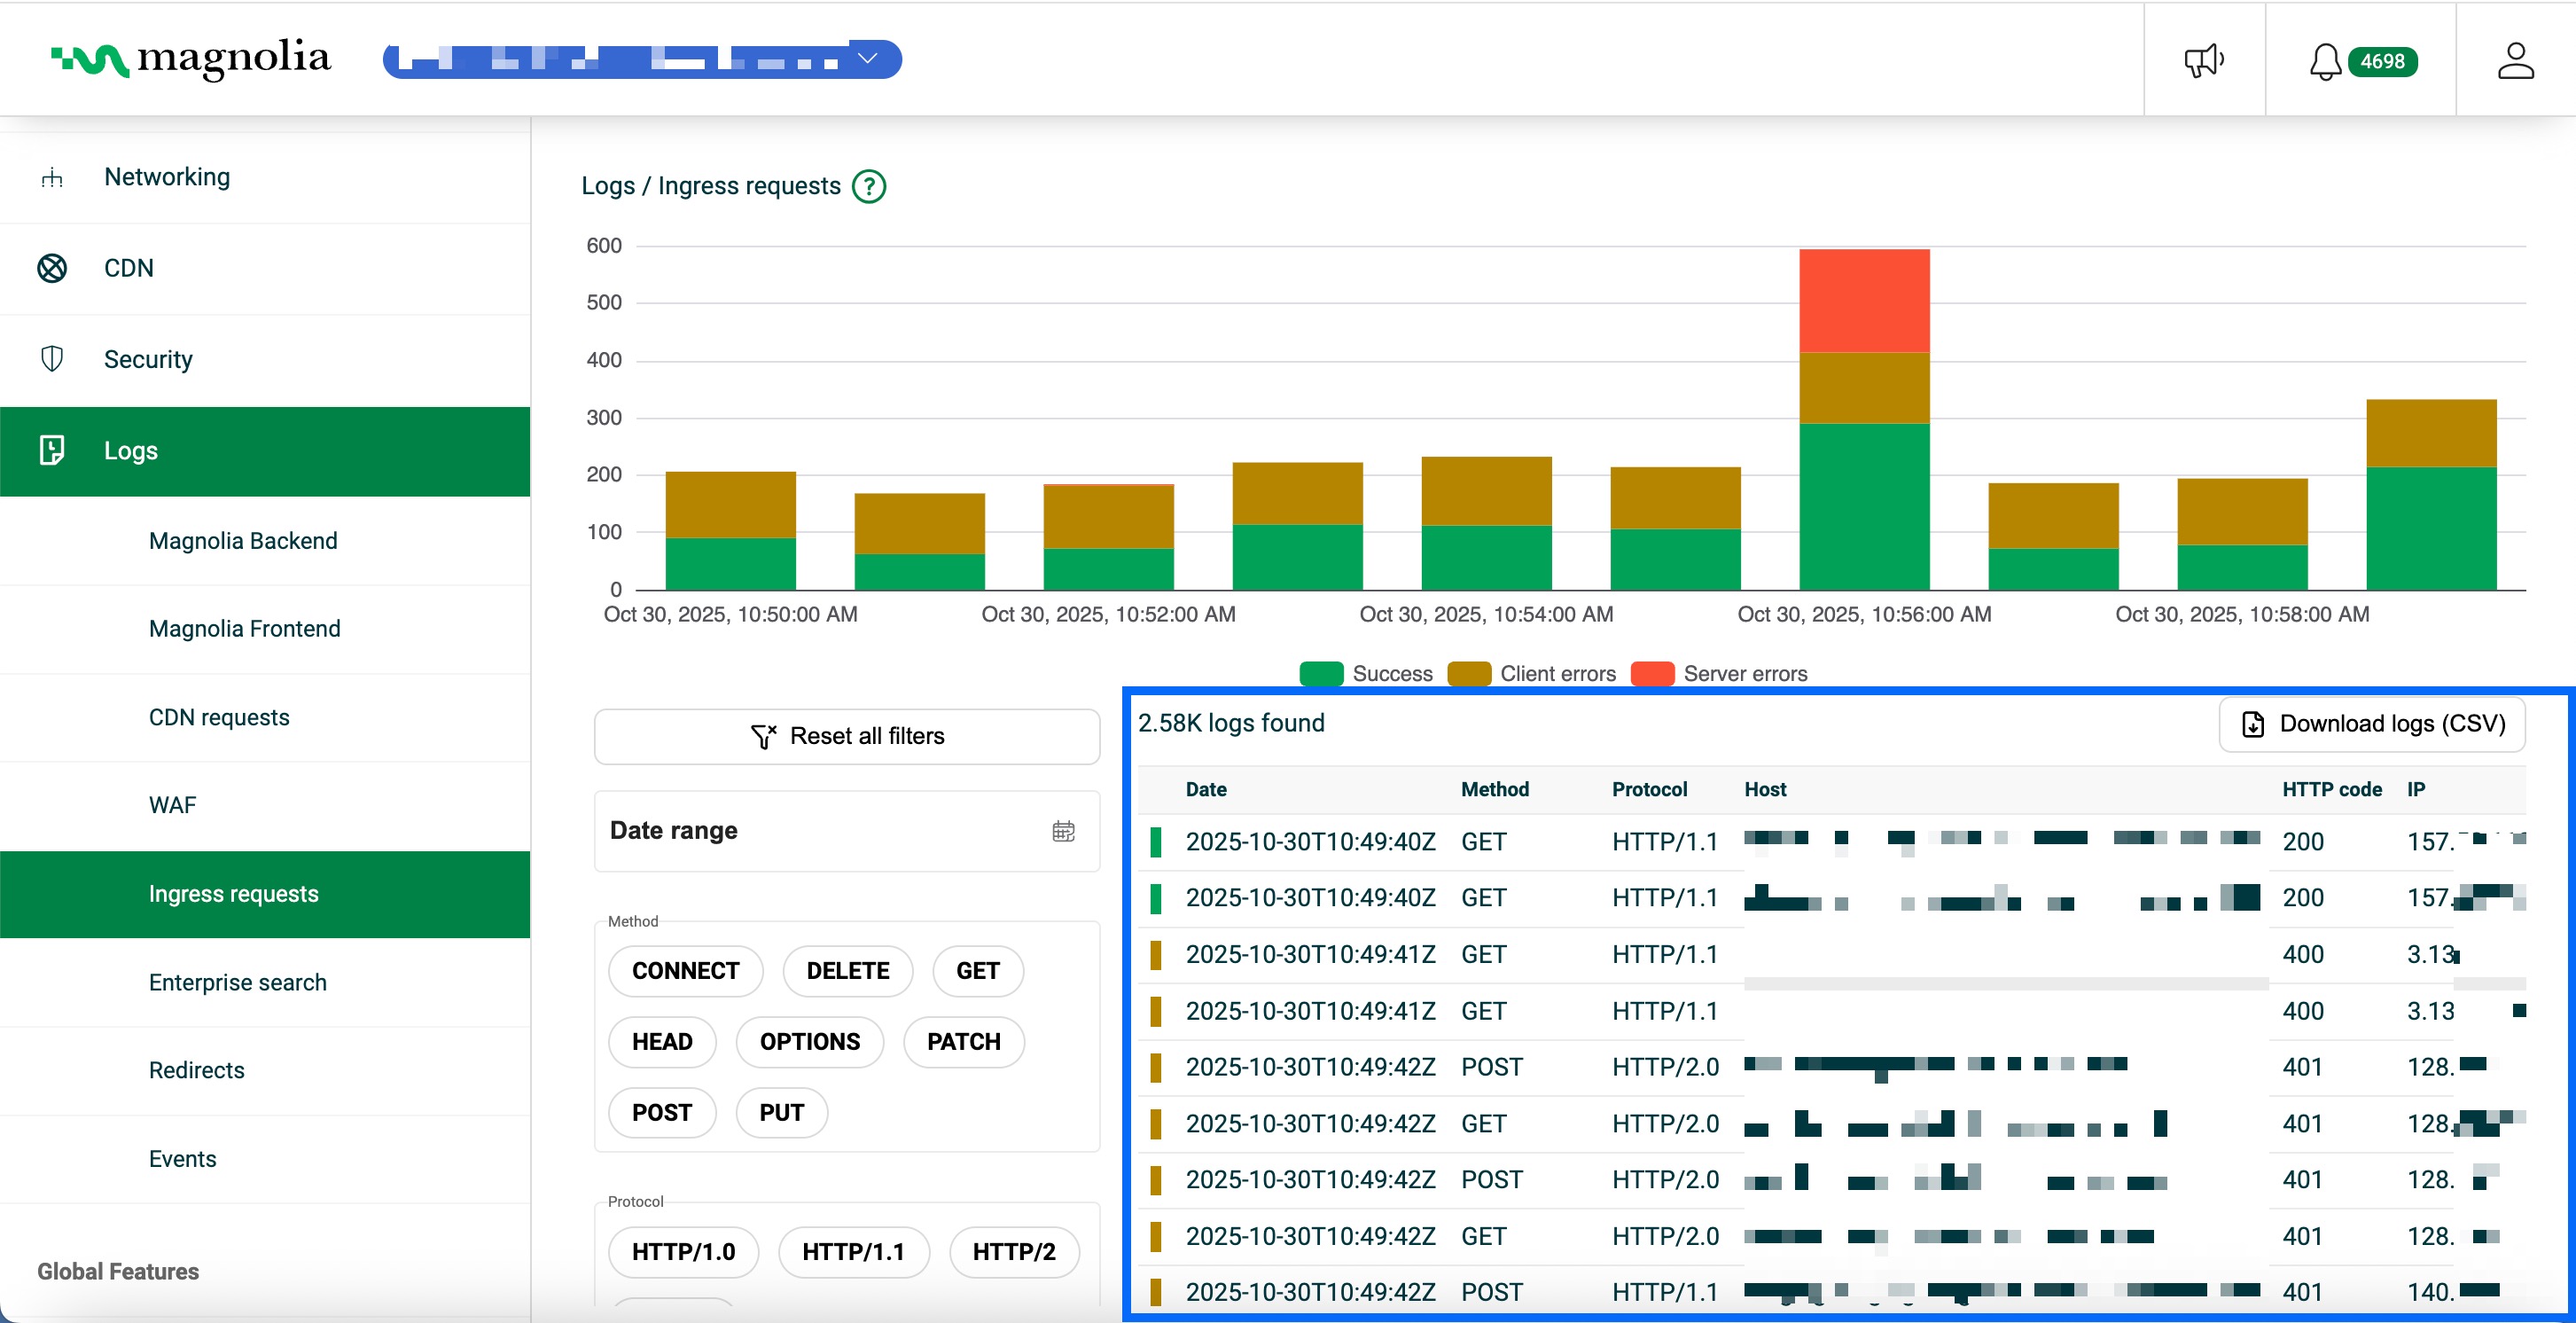
| Column | Description | Example |
|---|---|---|
| Date | Timestamp (ISO 8601, UTC) | 2025-10-30T10:18:05Z |
| Method | HTTP method | GET |
| Host | Hostname | author.staging.example.com |
| HTTP code | Response status code | 200 |
| Backend service | Kubernetes service that handled the request | magnolia-author-tomcat |
| Namespace | Kubernetes namespace | magnolia-prod |
| RTT | Round-trip time (ms) from Ingress to backend | 21 |
| Request ID | Unique request identifier | a1b2c3d4e5f6g7h8i9j0 |
Open a log row to see the full request, including the user agent.
Where a user agent appears, you can open its details in the Cockpit. The result is a decoded view of the client, such as device and browser class, along with related signals that can help you tell typical browsers from automated or unusual traffic.
RTT measures milliseconds for a request to travel from the Ingress to the backend service and back.