

Magnolia Application logs
Magnolia Application logs display log entries from Kubernetes Pods running your Magnolia application and database instances.
Key information tracked
- Application tier logs: Java application events from Magnolia Author and Public instances
- Database tier logs: PostgreSQL database operations and maintenance events
- Error and warning tracking: filter by log level (
FATAL,ERROR,WARN,INFO,DEBUG,TRACE) - Deployment topology: each log identifies its source namespace, pod, container, component, and tier
Select desired cluster
Select your desired cluster from the dropdown menu at the top of the Cockpit.

View Magnolia Application logs
From Logs > Magnolia Application:
- Select your desired cluster.
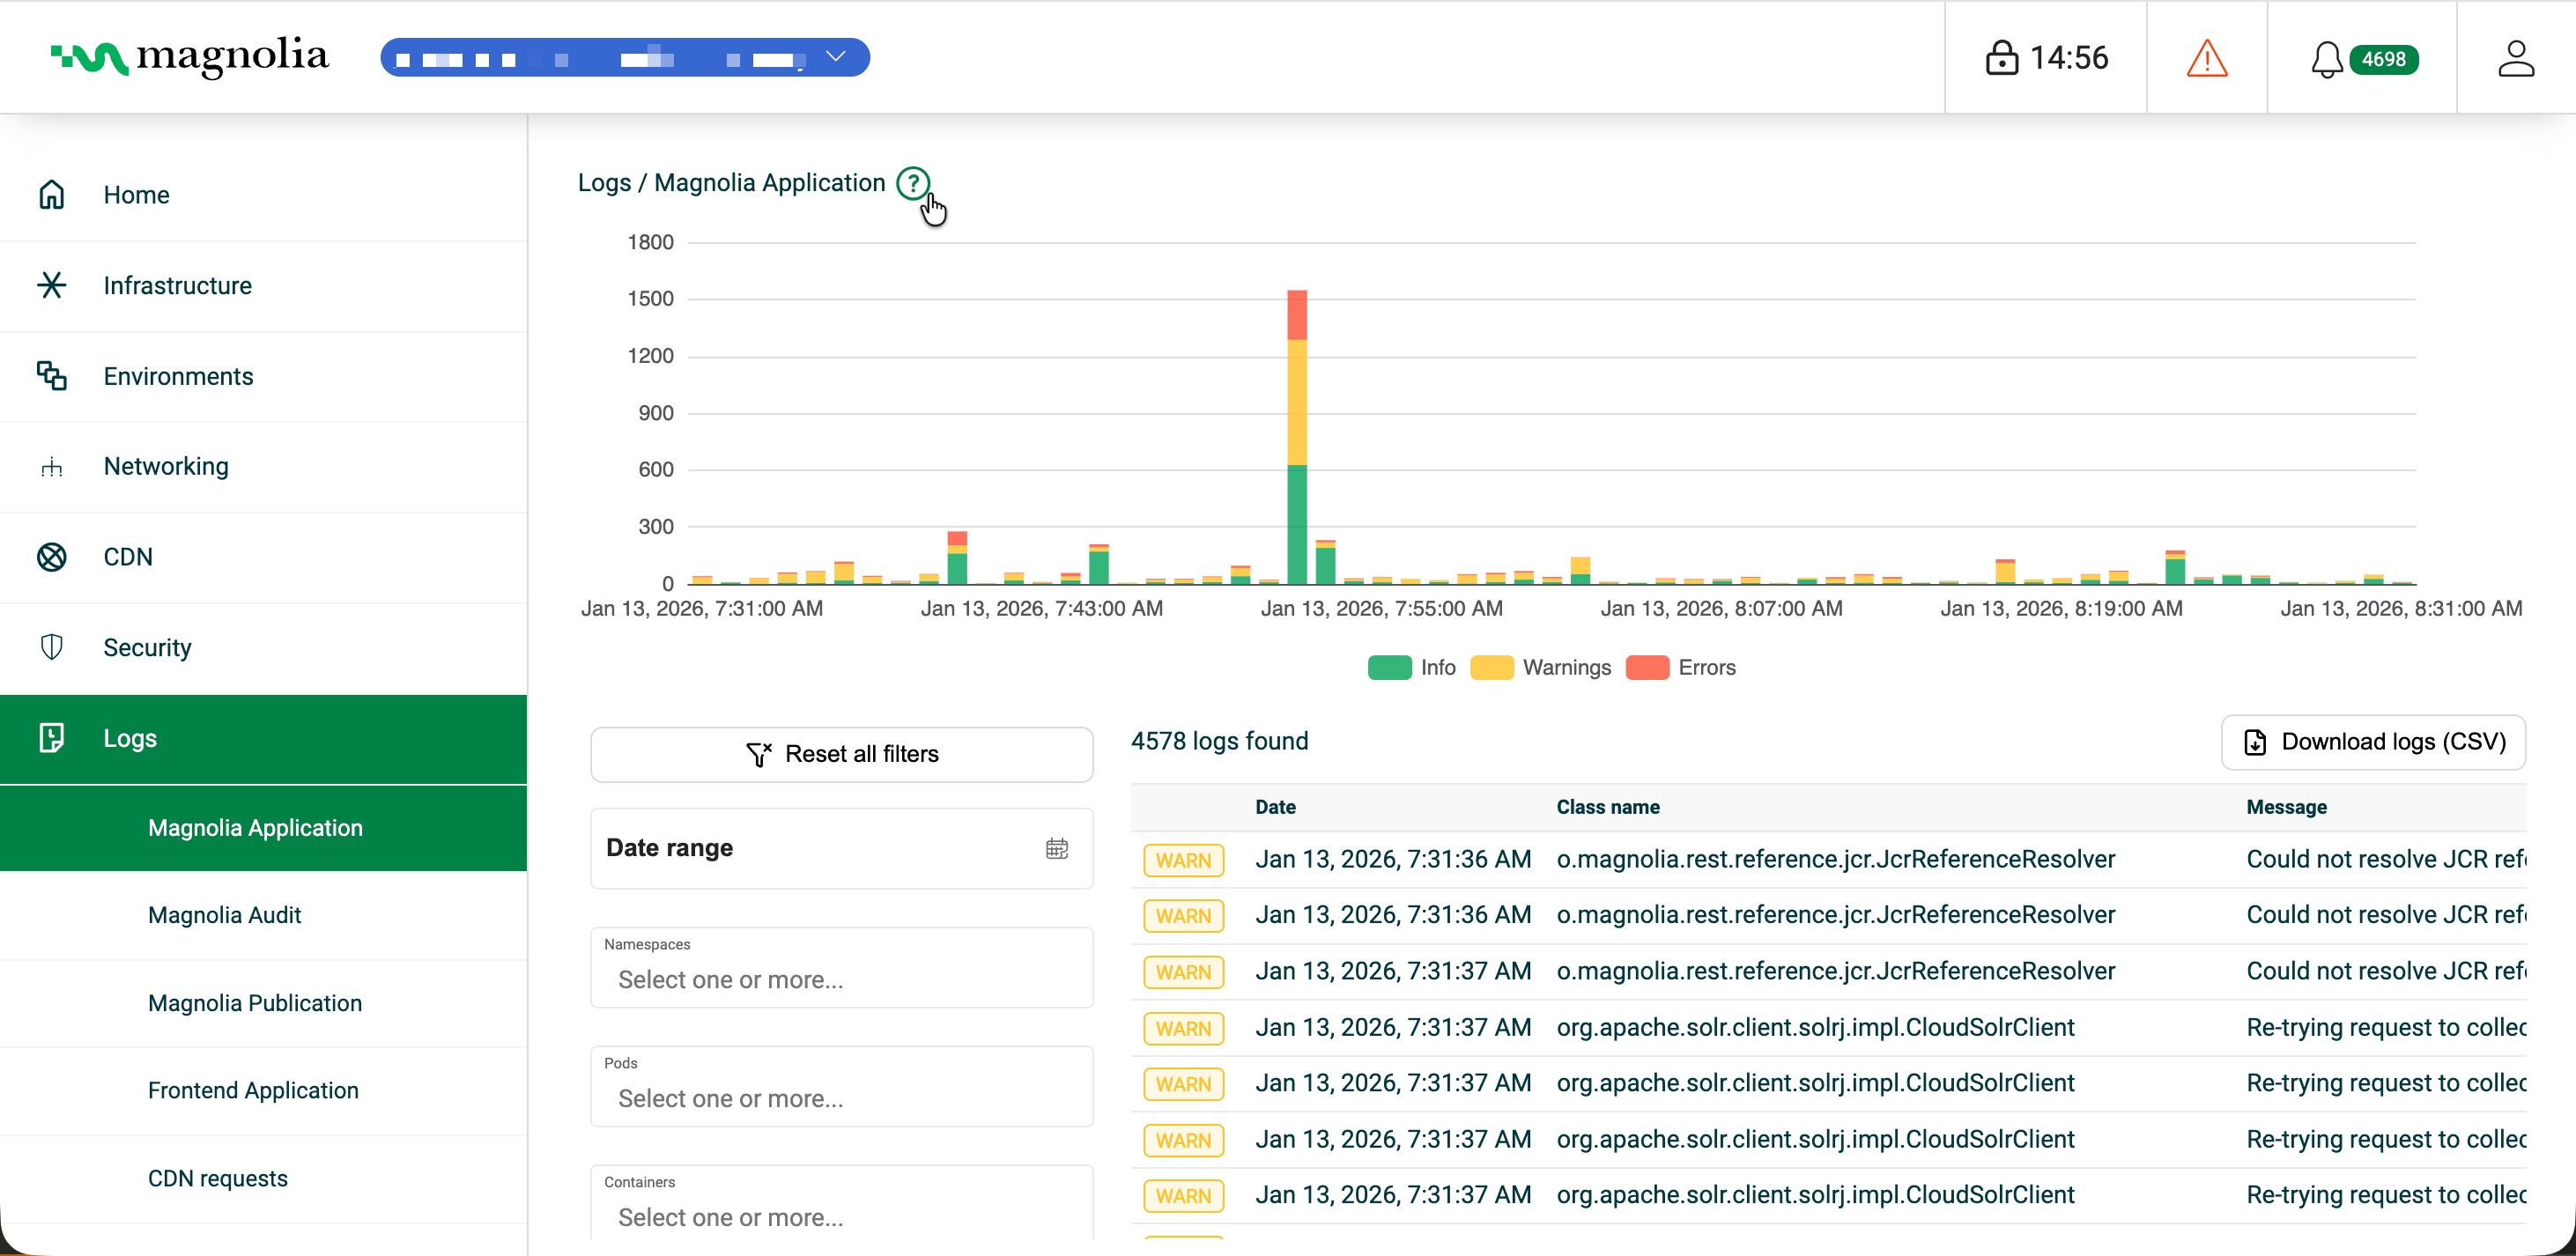
- View the chart (histogram) to see log activity over time, including successful operations, warnings, and errors.
- In Filters, set date range, namespaces, pods, containers, components (
AUTHOR/PUBLIC), tiers (APP/DATABASE), levels, and message filters.
Details table
Click Download logs (CSV) to export the rows that match your current filters.
Click a row for the full entry.
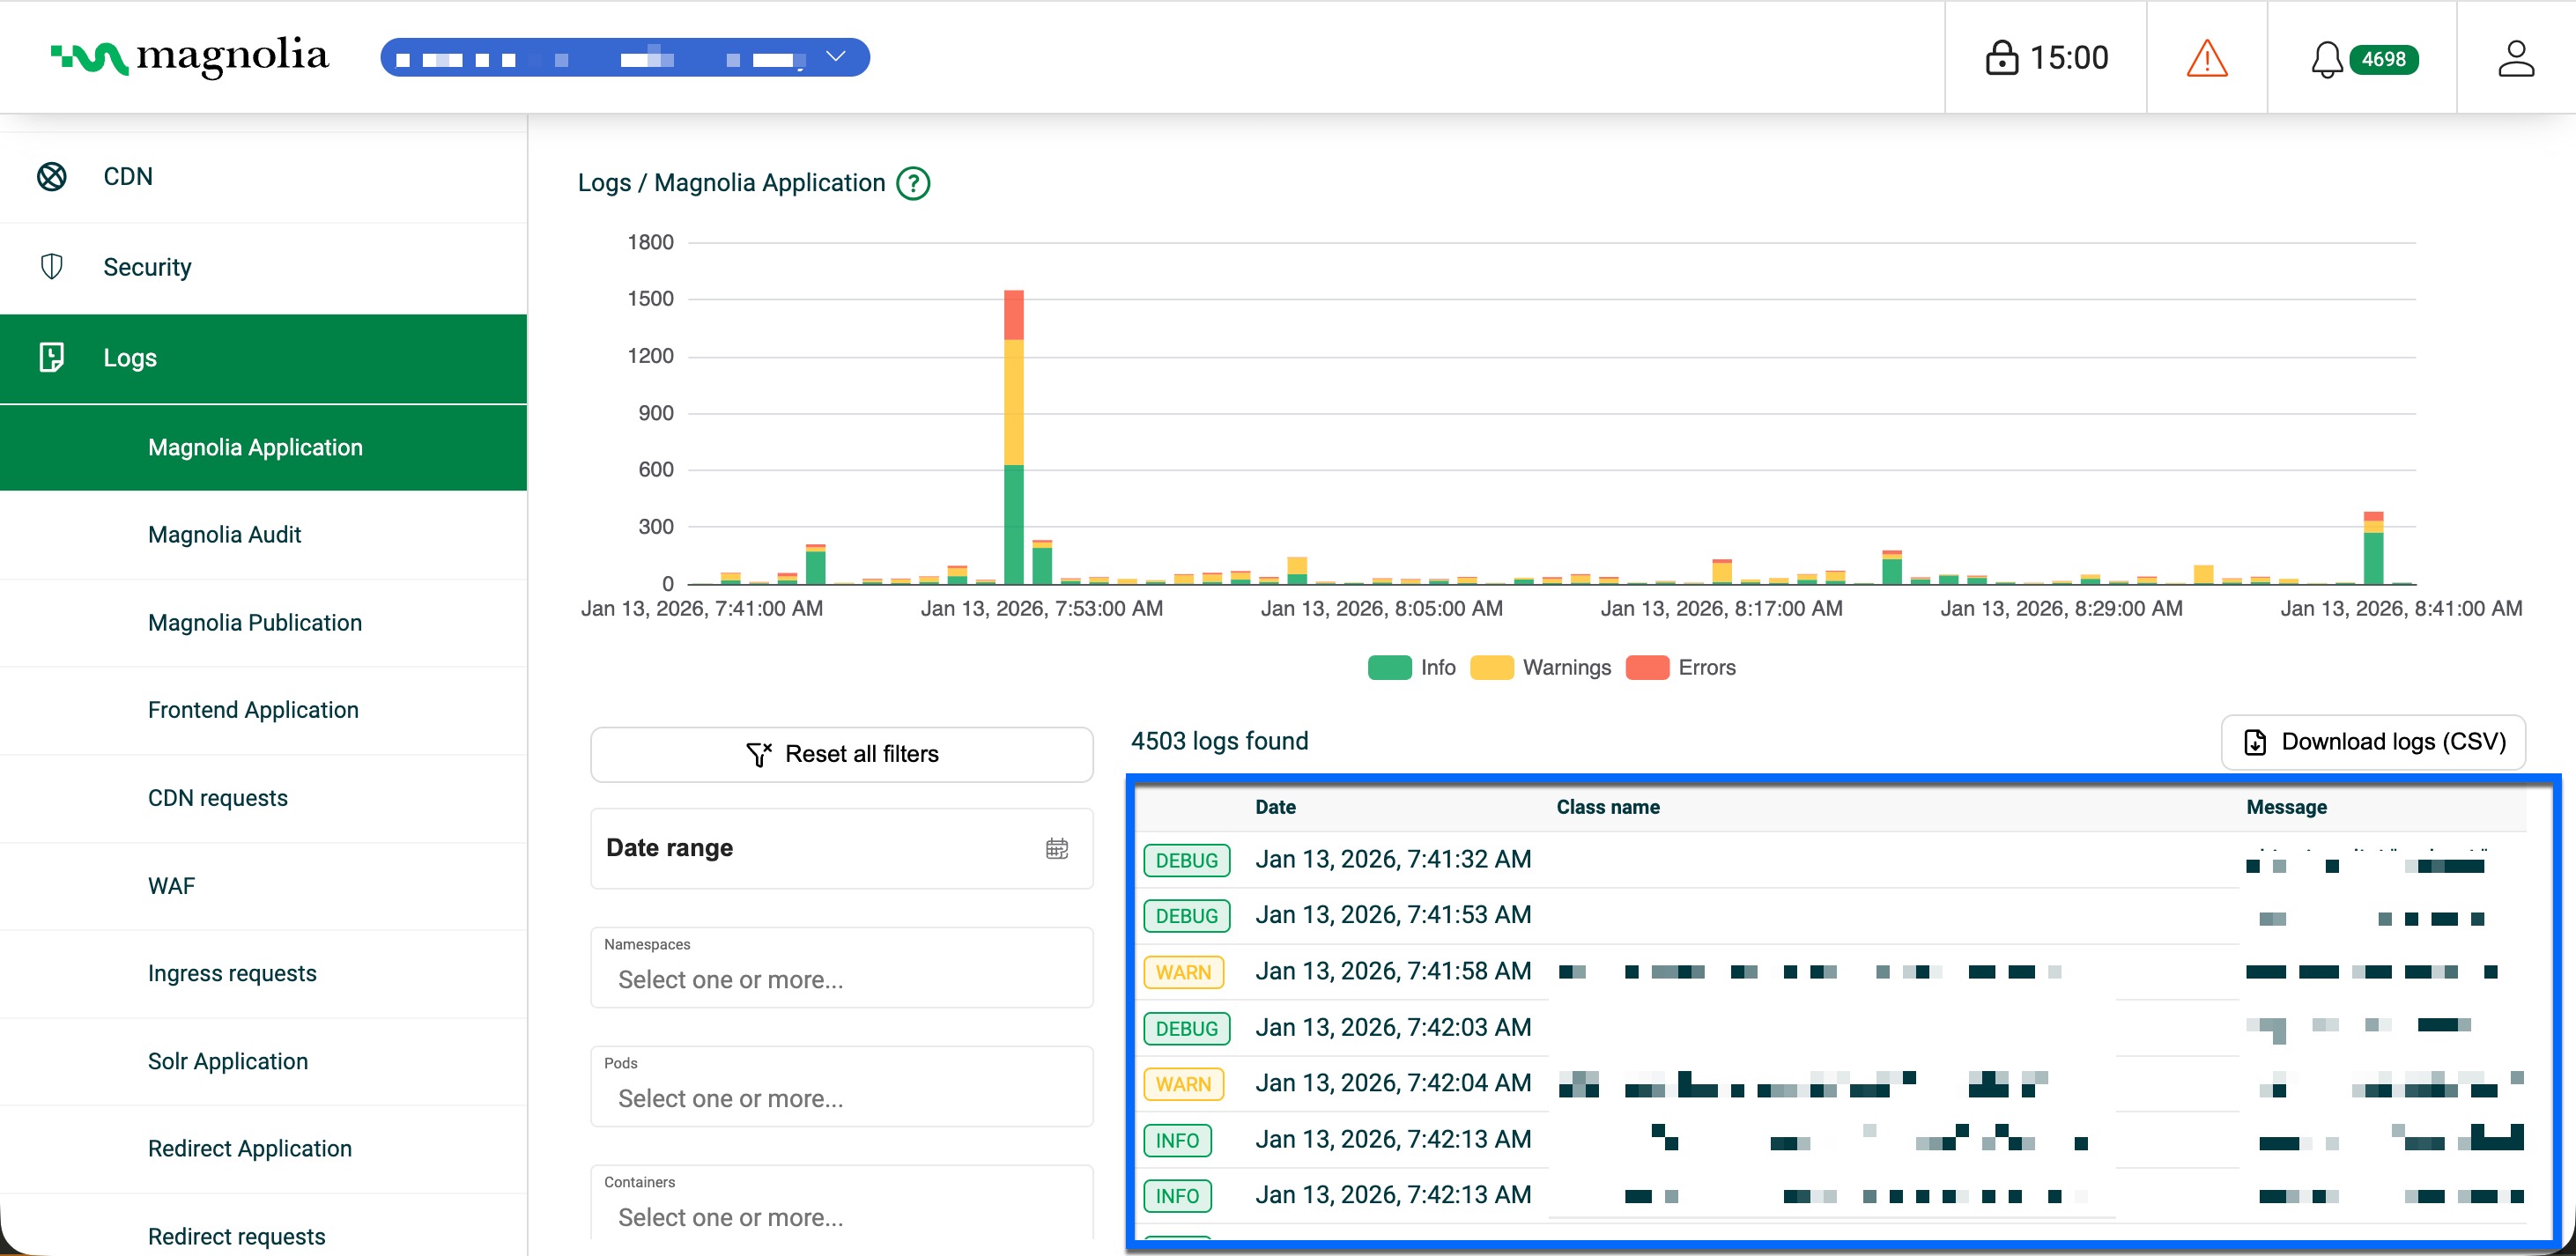
| Column | Description | Example |
|---|---|---|
| Level | Severity of the log entry | WARN |
| Date | Timestamp when the log was created | Nov 10, 2026, 10:05:46 AM |
| Class name | Java class that generated the log (or LOG for database logs) | info.magnolia.cms.security.CsrfCookieTokenFilter |
| Message | Log message content | 'csrf' cookie is set with 'Secure' attribute… |
| Namespace | Kubernetes namespace | staging |
| Pod | Kubernetes pod | staging-magnolia-helm-author-0 |
| Container | Container within the pod | author-instance |
| Component | Magnolia component (AUTHOR or PUBLIC) | AUTHOR |
| Tier | Infrastructure tier (APP or DATABASE) | APP |