

Statistics
The Statistics subsection reveals critical information about your DX Cloud deployment and is broken down in individual tabs in the Cockpit.
Select your Release and Range and apply the filters to display environment statistics.
Select desired cluster
Select your desired cluster from the dropdown menu at the top of the Cockpit.

Sidebar filters
The sidebar filters allow you to refine your view by selecting specific criteria.
- Release: defaults to the environment you are currently in (typically
prodordev). - Pod: select the pod you want to analyze (for example
prod-magnolia-helm-author-0orprod-magnolia-helm-public-0). - Date Range: select the time period using preset ranges or the calendar picker for custom dates.
- Memory Unit: choose how to display memory sizes (
KiB,MiB,GiB, orTiB). - Data resolution: choose the time interval for data aggregation (
minute,hour,day,week, ormonth).
Click Apply filters to update the view.
Availability
View overall availability for the selected environment and pod. This is shown as a percentage.
Requests
Monitor request volume and rate for the selected environment and pod.
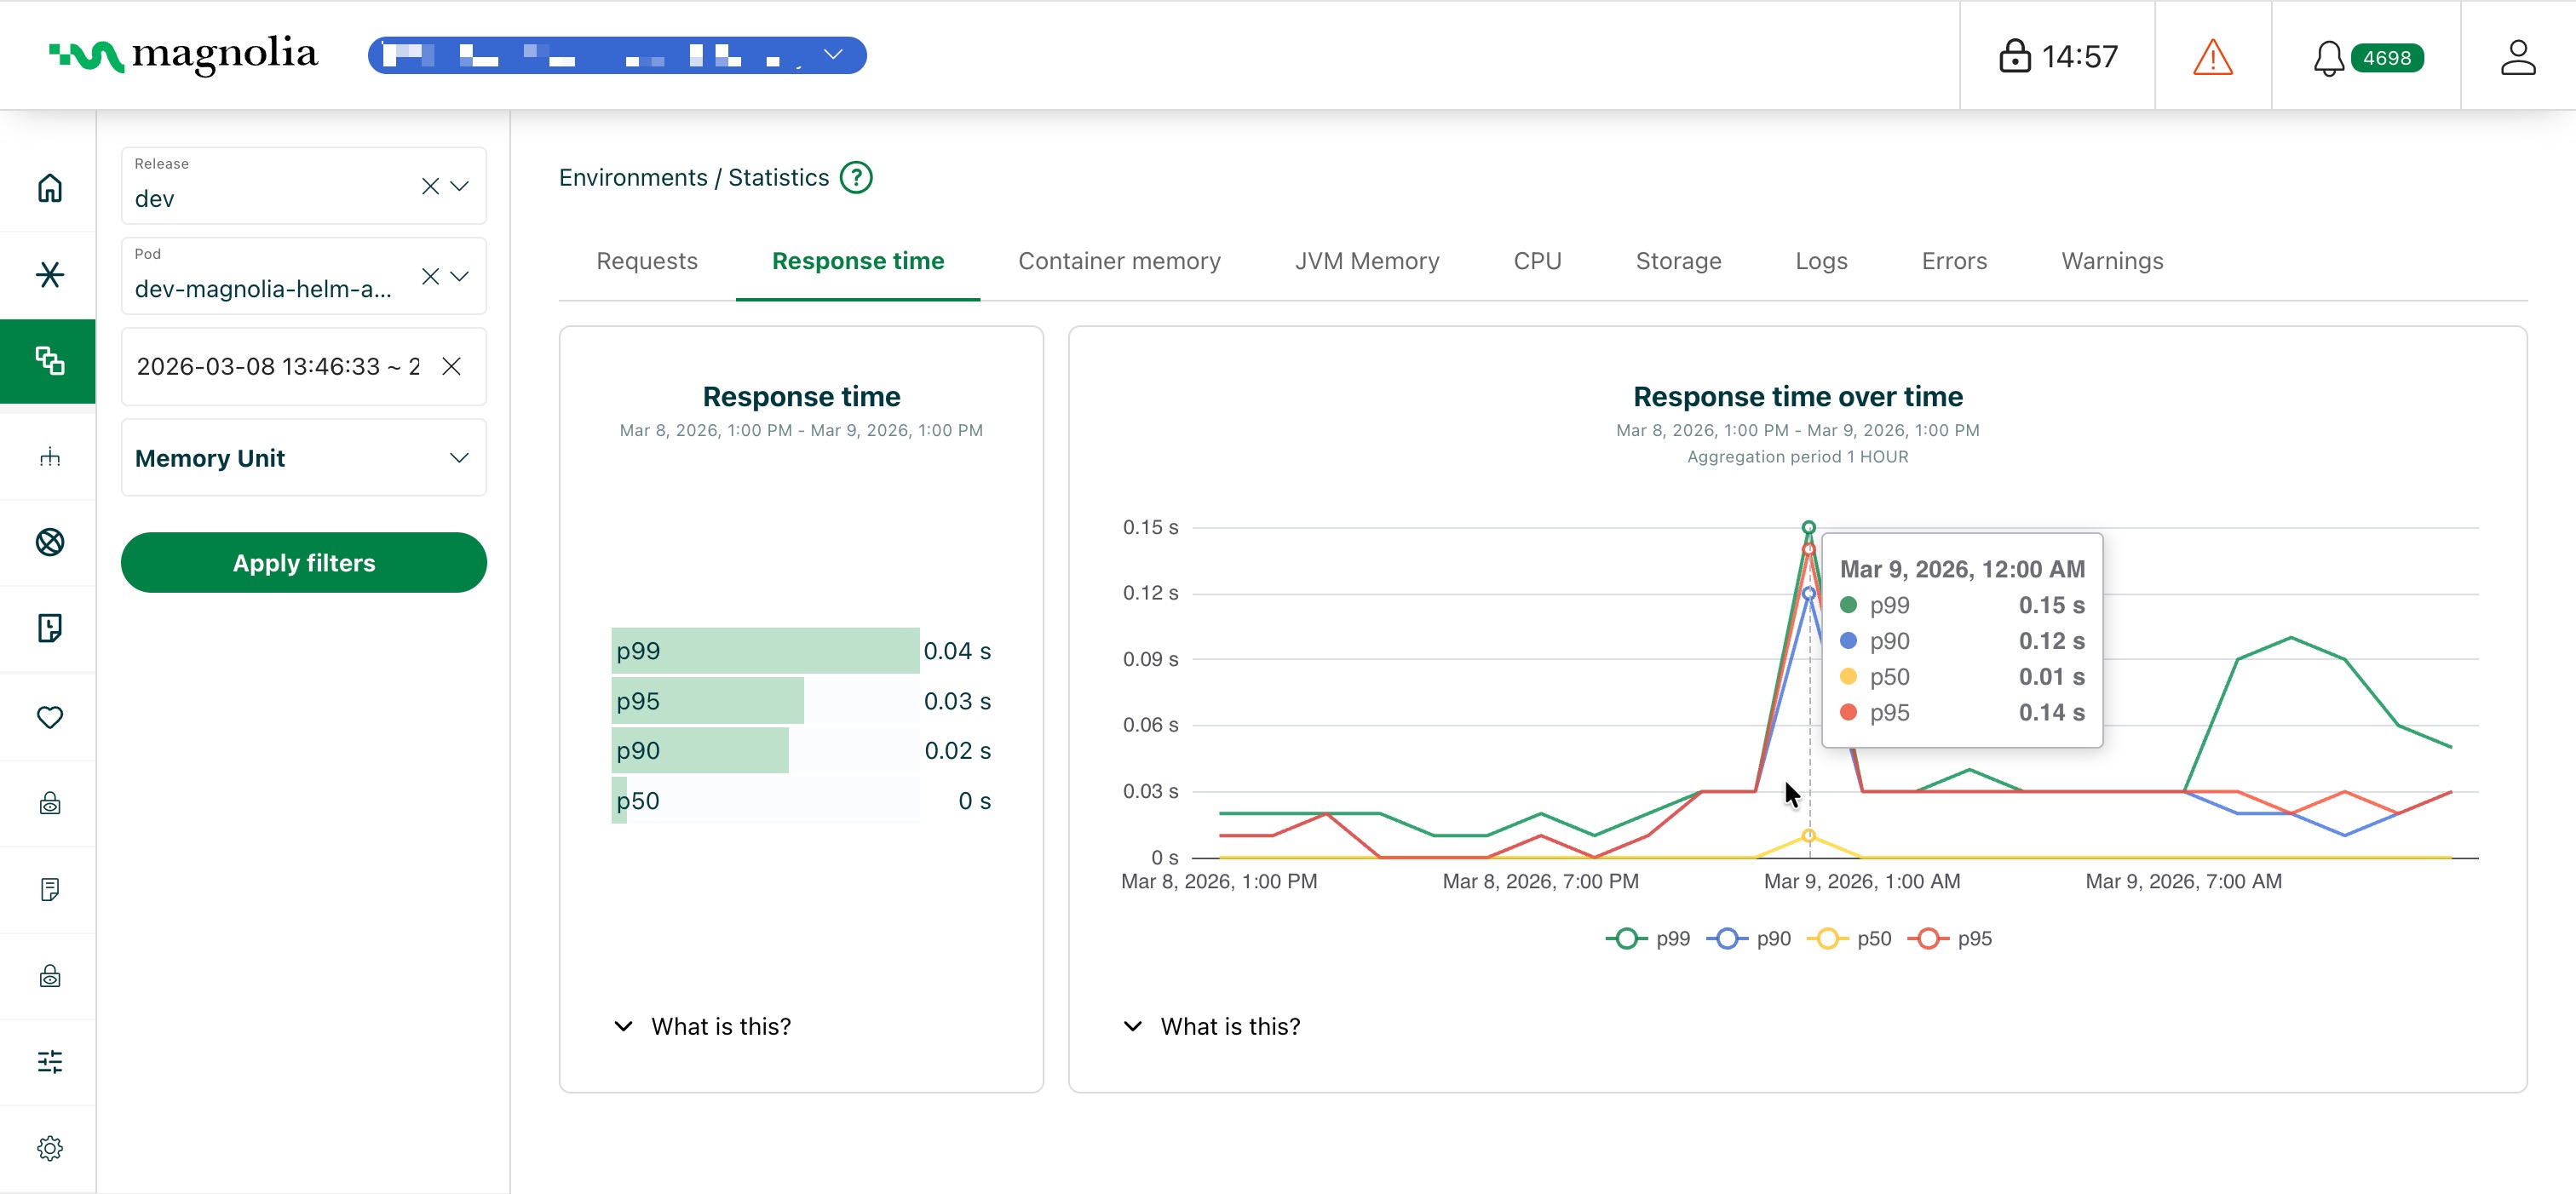
Response time
See how quickly the environment responds to requests (averages and distribution).
This is shown as a percentile (p50, p95, p99).
Percentiles:
- p50 (median): half of requests were faster than this, half slower.
- p90: 90% of requests completed within this time; 10% were slower.
- p95: 95% of requests completed within this time; 5% were slower.
- p99: 99% of requests completed within this time.
Container memory
View memory usage and free memory at the container level. This shows the latest memory, average memory, and memory over time for the container.
JVM memory
Inspect JVM heap usage, committed and used memory, and breakdown by memory area. This shows JVM ratio, JVM used, JVM committed, JVM committed per area, JVM used per area, JVM max, and JVM max per area.
CPU
Check CPU utilization for the environment. This contains sections for the latest CPU, average CPU, and CPU over time.
Storage
View storage usage and trends for the environment. This shows capacity storage, available storage, and used storage.
Logs
Review log volume and patterns for the selected scope. This shows total log entries, logs over time, logs rate over time, logs per level, and logs per level over time.
Errors
See error counts and trends to spot failures and issues. This shows error rate over time, error ratio, error info ratio, top error classes, and mean time between error.
Warnings
Review warning counts and trends for potential problems. This shows warning rate over time, warning ratio, warning info ratio, top warning messages, and mean time between warning.