

Magnolia publications
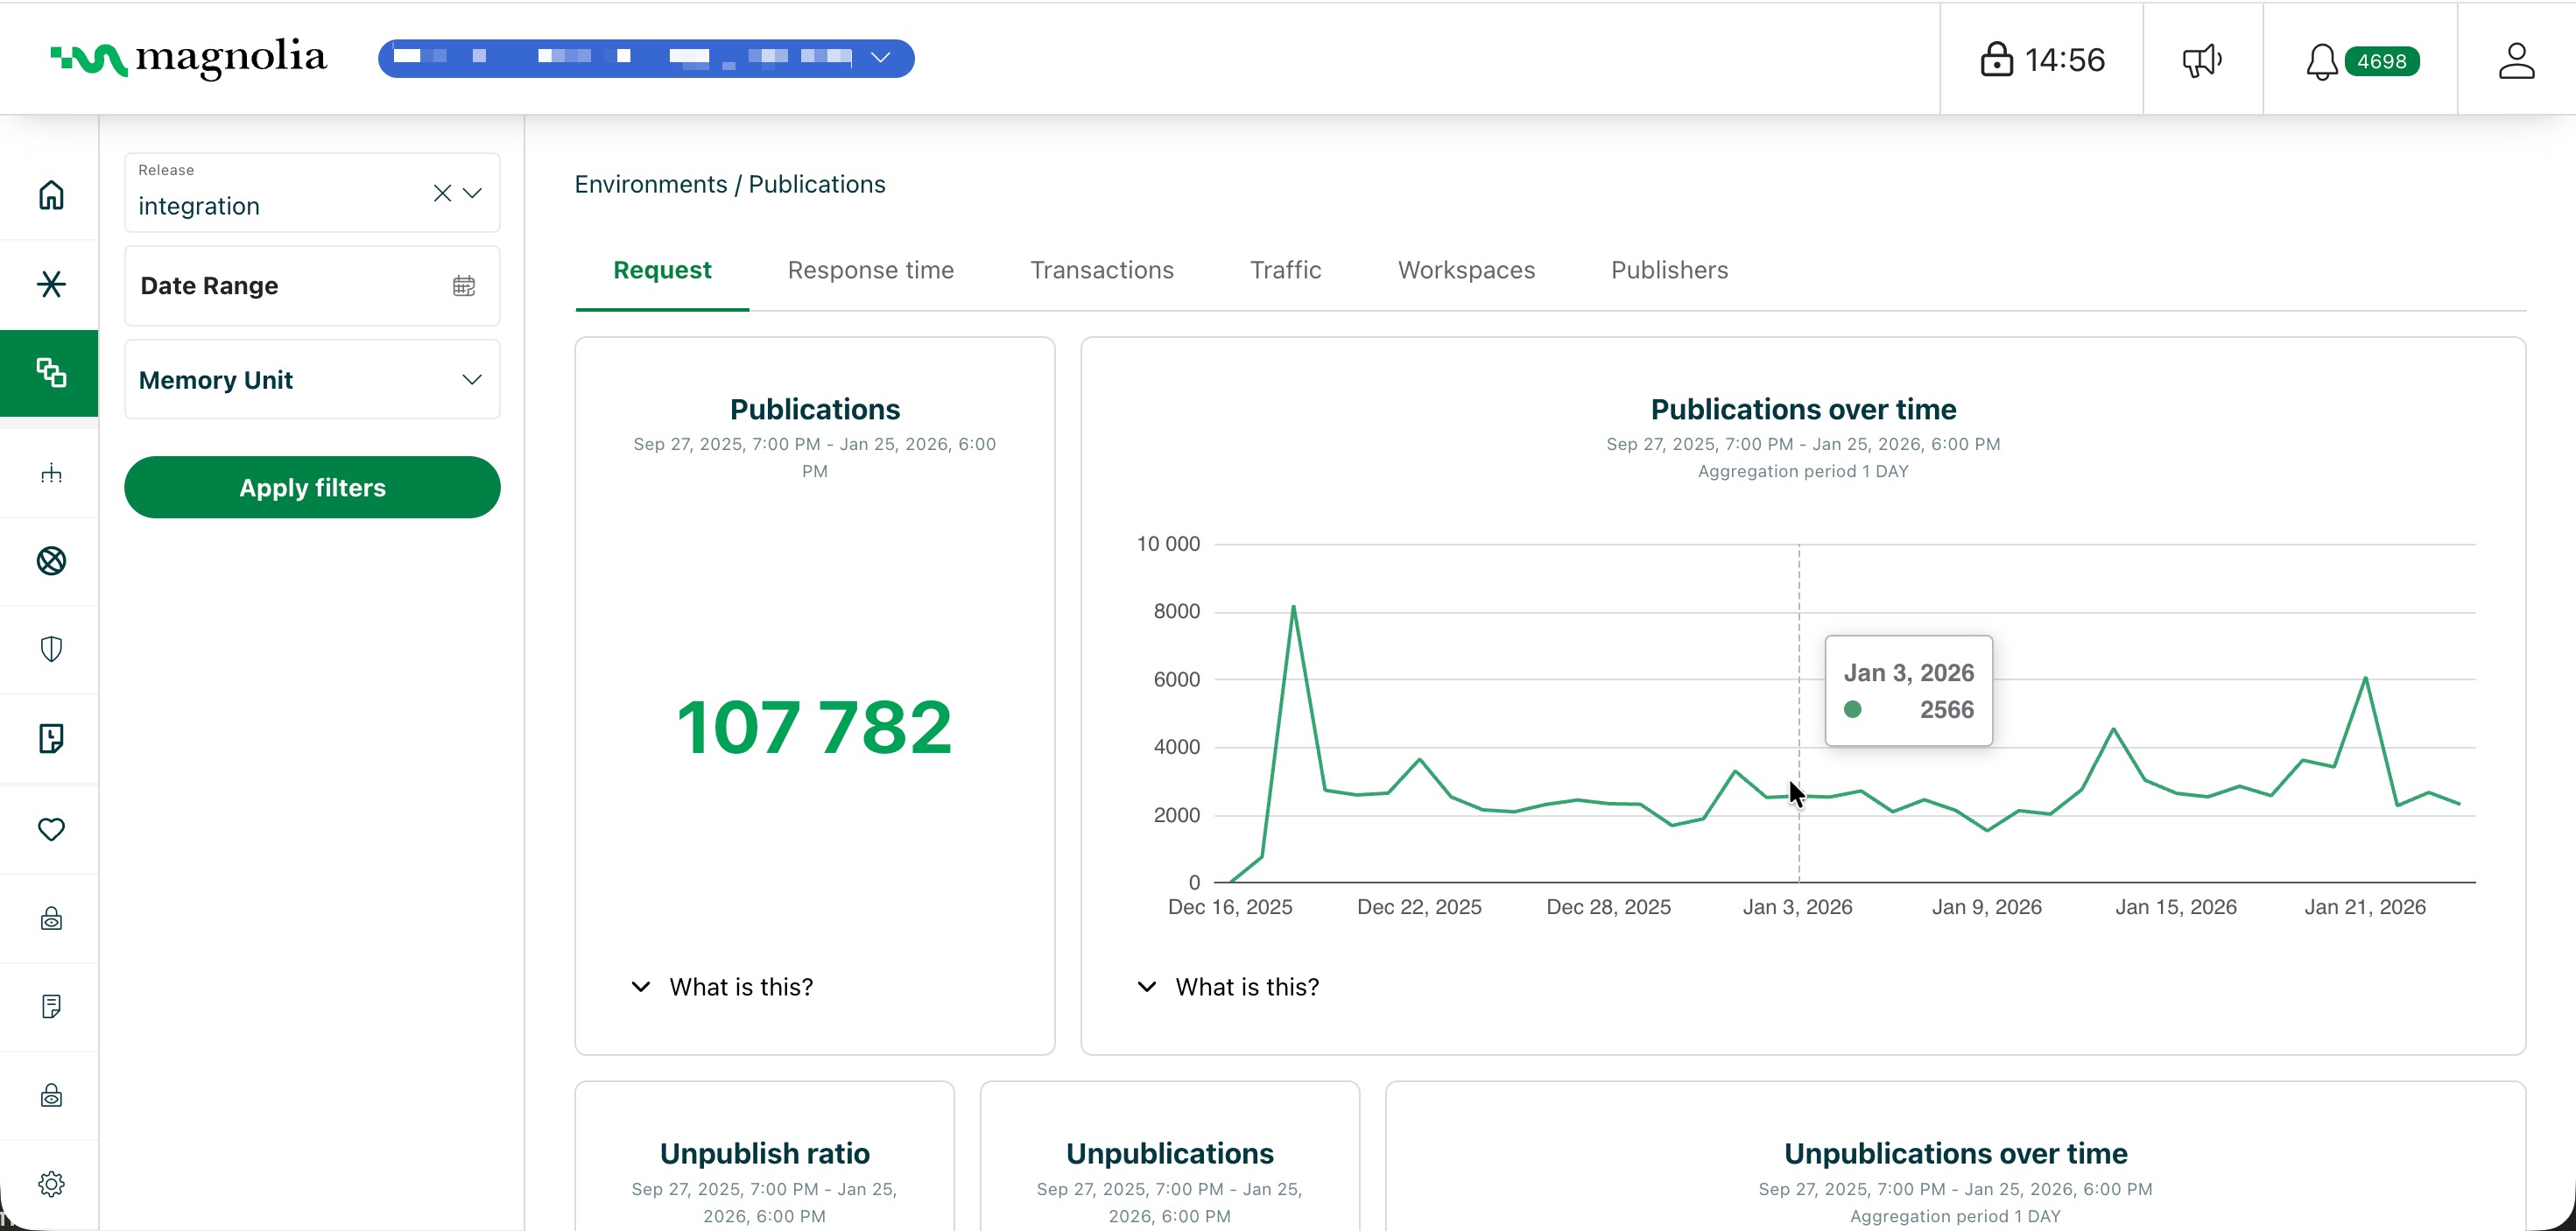
The Magnolia Publications section displays metrics related to publishing operations between your Author and Public instances. Use this dashboard to monitor publication volumes, response times, transaction health, and identify potential issues across your content delivery workflow.
Select your desired Release from the sidebar filters as the metrics displayed are specific to this selection.
Select desired cluster
Select your desired cluster from the dropdown menu at the top of the Cockpit.

Sidebar filters
The sidebar filters allow you to refine your view.
| Filter | Description |
|---|---|
| Release | Select the namespace (release) to analyze. Defaults to the first available option. |
| Date range | Select the time period for time series charts using preset ranges or the calendar picker for custom dates. |
| Memory unit | Choose how to display data sizes: KB, MB, GB, or TB. |
Click Apply filters to update the view with your selected criteria.
Request
The Request tab provides an overview of publication and unpublication activity from the mgnlPublication metrics family.
Publications
View the total number of publication operations.
- Current count: the total publications during the selected period.
- Publications over time: a time series chart showing publication activity trends.
Unpublications
View unpublication activity and the ratio of unpublish operations.
- Current count: the total unpublications during the selected period.
- Unpublish ratio: the proportion of operations that were unpublications rather than publications.
- Unpublications over time: a time series chart showing unpublication activity trends.
Success ratio
View the percentage of publication operations that completed successfully.
- Current success ratio: the latest success rate percentage.
- Success ratio over time: a time series chart showing how publication success rates have changed.
Top error messages
View the most common error messages from failed publication operations, ranked by frequency. Identifying common errors helps prioritize troubleshooting efforts and address the most impactful issues first.
Response time
The Response time tab provides latency metrics for publication operations.
Latency
View the average time for publication operations to complete.
- Current latency: the mean duration from initiating a publication to confirmation of delivery.
- Latency over time: a time series chart showing publication response time trends.
P95 latency
View the 95th percentile publication latency, which reveals the experience of slower operations while excluding extreme outliers.
- Current P95 latency: the response time threshold that 95% of publication operations fall within.
- P95 latency over time: a time series chart showing how P95 latency has changed.
Subscriber response time
View average response times broken down by individual Public instance subscribers.
- Current response times: a breakdown of publication latency by subscriber.
- Response time over time: a time series chart showing how each subscriber’s response time has varied.
Transactions
The Transactions tab provides metrics on publication transaction health.
Rollback ratio
View the percentage of publication transactions that were rolled back due to failures.
- Current rollback ratio: the proportion of publication commits that failed and had to be reversed.
- Rollback ratio over time: a time series chart showing transaction rollback trends.
Traffic
The Traffic tab provides metrics on data transfer volumes during publication operations.
Data size
View the total volume of data transferred during publications.
- Current data size: the cumulative size of content published from Author to Public instances.
- Data size over time: a time series chart showing data transfer trends.
Workspaces
The Workspaces tab provides publication metrics broken down by JCR workspace.
Total by workspace
View the total number of publication operations for each workspace (for example website, dam, or config).
This helps identify which workspaces have the most publishing activity.
Failures by workspace
View the total number of failed publication operations for each workspace. This helps identify if publication problems are isolated to specific content types or distributed across the system.
Publishers
The Publishers tab identifies your most active content publishers.
Top publishers
View a ranked list of users by publication activity during the selected period. This helps identify content authoring patterns and workload distribution across your team.