

Redirects statistics
The Networking Redirects statistics section allows you to monitor redirect performance and troubleshoot issues at a glance.
Select desired cluster
Select your desired cluster from the dropdown menu at the top of the Cockpit.

Sidebar filters
The sidebar filters allow you to refine your view by selecting specific criteria.
- Release: select the environment such as
devorprod. - Date Range: select the time period using preset ranges or the calendar picker for custom dates.
- Memory Unit: choose how to display data volumes (
KiB,MiB,GiB,TiBby default, or SI unitsKB,MB,GB,TB). - Hosts: filter by specific hostnames or domains (supports multiple selections).
- Data resolution: choose the time interval for data aggregation (
Minute,Hour,Day,Week, orMonth).
Click Apply filters to update the view.
Availability
View overall availability of the redirect service. The average availability summarizes the period, while the time series highlights changes over time.
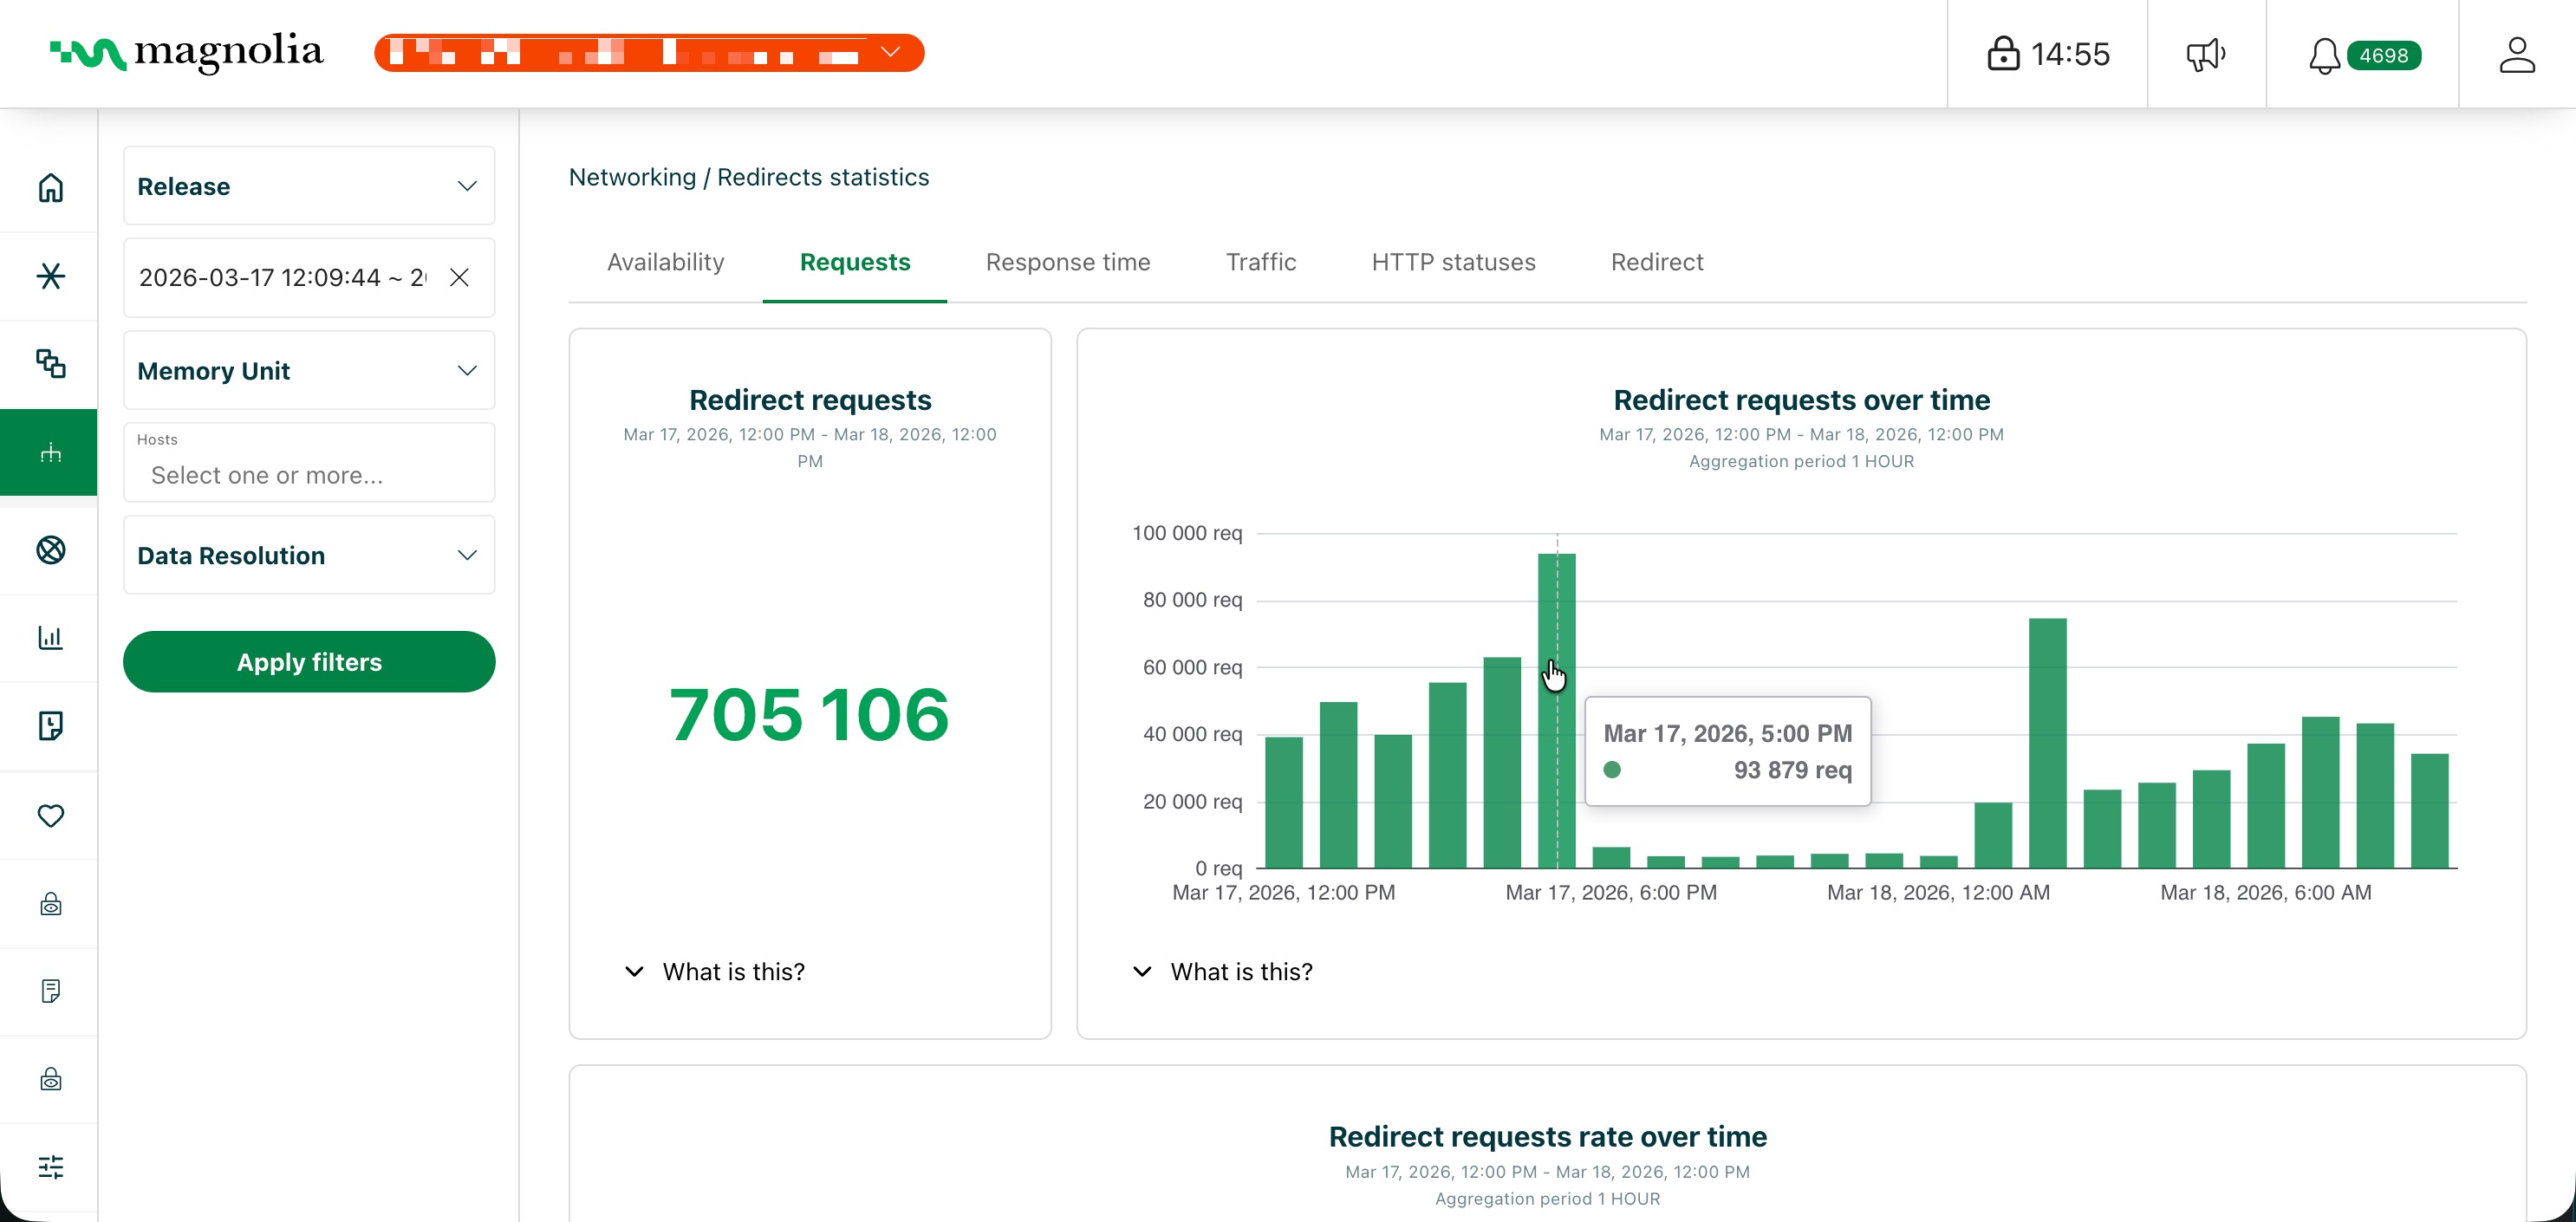
Requests
See total and per-interval request volumes. Use the protocol breakdown to understand HTTP/HTTPS usage patterns.
Response time
Analyze response time trends to identify slow responses. The time series shows response time trends over time.
Traffic
Monitor overall and per-interval traffic volumes and rates to understand throughput patterns.
HTTP statuses
Examine status code distributions, error ratios, and 3xx/4xx/5xx trends to diagnose client or server issues.
Redirect
View redirect ratios to understand how often requests result in redirects. The time series shows redirect behavior patterns across the selected period.
Each card has a What is this? section for metric details in the Cockpit.