

Frontend application logs
Magnolia Frontend application logs display log entries from Kubernetes pods running your frontend application instances.
Key information tracked
- Frontend application events: runtime messages from frontend components serving your sites
- Error and warning tracking: filter by log level (
FATAL,ERROR,WARN,INFO,DEBUG,TRACE) - Site context: site associated with a log entry (for example
travel) - Deployment topology: namespace, pod, and component (
author-instanceorpublic-instance)
Select desired cluster
Select your desired cluster from the dropdown menu at the top of the Cockpit.

View Frontend application logs
From Logs > Frontend application:
- Select your desired cluster.
- View the chart to see frontend log activity over time.
- In Filters, set date range, namespace, pod, component, log level, site, and message content.
- Click Apply filters.
When you Apply filters, the selection persists: if you reload the page, you see the same filter selection.
It also ensures you can share the selection and the recipient sees the same view as you do.
Example
https://cockpit.magnolia-platform.com/logs/events?from=2026-03-06T16:25:31.842Z&to=2026-03-06T17:25:31.842Z&In this case, the URL shows event logs for the last hour on the selected date.
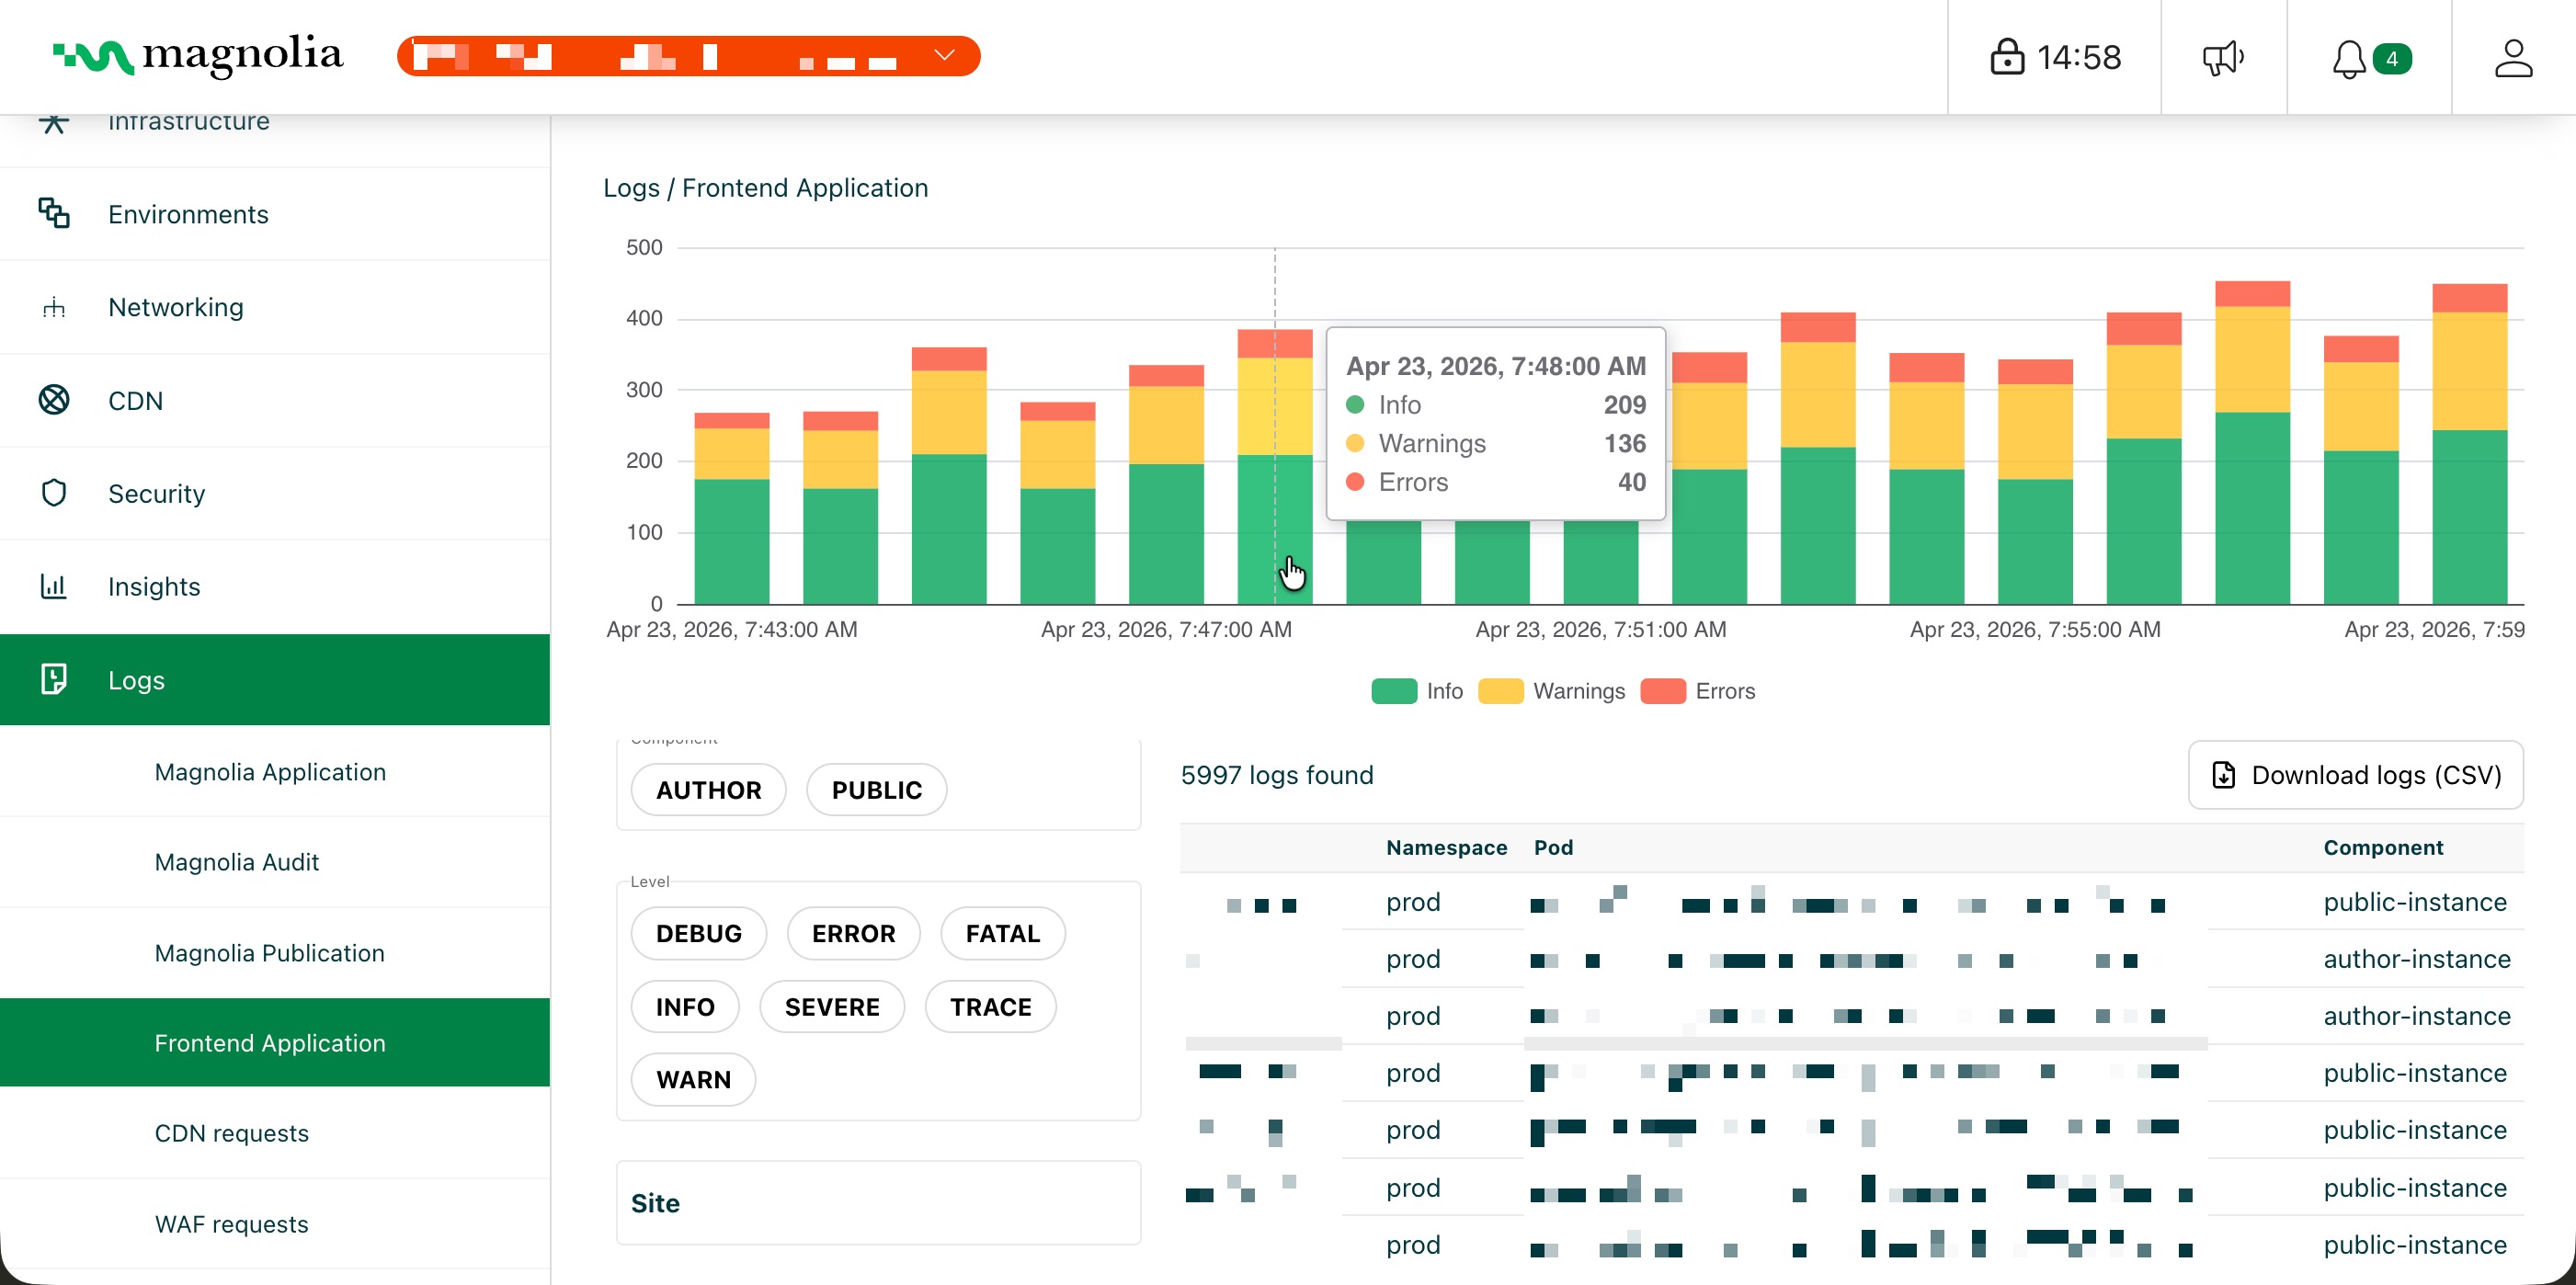
Details table
Click Download logs (CSV) to export the rows that match your current filters.
| Column | Description | Example |
|---|---|---|
| Level | Severity level | INFO |
| Date | Timestamp | Mar 14, 2026, 4:01:50 PM |
| Site | Frontend site context | travel |
| Message | Log message content | Rendering completed for page /travel/home |
| Namespace | Kubernetes namespace | staging |
| Pod | Frontend pod | staging-magnolia-frontend-public-7c8f9d6b4f-g2k9x |
| Component | Frontend component | public-instance |